How Economic Indicators And Population Demographics Impact Incident Rates
“Digging Deeper” is the Alliance for Innovation and Infrastructure’s (Aii) new blog series focused on using the Common Ground Alliance’s Damage Information Reporting Tool’s (DIRT) inaugural interactive data dashboard to track indicators, trends, and correlations with the goal of zeroing in on the underlying causes of excavation damage incidents. It is worth noting that all of the data reflected in DIRT’s dashboard, and consequently “Digging Deeper” was submitted voluntarily. As we pointed out previously, “[w]ithout mandatory reporting laws in place, it is impossible to get reliable data on actual incident occurrences,” making this the best available data, but not entirely complete.
Volume 1 of “Digging Deeper” focuses on whether economic growth or population demographics from state to state had identifiable impacts on incident rates. We started by looking at which states had the lowest incident rates (defined as incidents per 1,000 transmissions). Then we looked for correlations between:
1) Incidents and GDP growth; and
2) Total incidents and population.
After examining incident rates and potential correlations between each of these factors, we looked at whether or not certain states performed consistently near the top or bottom of the different analyses, which will help guide our future efforts.
Incident Rates
The 10 states with the best incident rates, i.e. least incidents per 1,000 transmissions are (in order from lowest to highest): Rhode Island, Alaska, Hawaii, Delaware, Massachusetts, Washington, D.C., Virginia, Vermont, Connecticut, and Montana. Many of these states have lower population density and less economic activity than the average state, which is to be expected. The following three analyses will control for those factors in searching for correlations.
The 10 states with the worst incident rates, i.e. most incidents per 1,000 transmissions are (in order from highest to lowest): Missouri, Colorado, Nebraska, Kentucky, Iowa, North Carolina, Louisiana, Idaho, Kansas, and Tennessee. It is difficult to identify a common theme among these states without further examination of other factors.
Incidents and GDP Growth
Our initial hypothesis (which proved incorrect) was that the total number of incidents would show a relatively strong correlation with each state’s GDP growth, or lack thereof. In theory, a stronger economy means increased industrial activity, more housing starts, and a general increase in construction activity across the board. As seen in the chart below, there were some isolated cases where this proved true, but by in large this was not the trend.
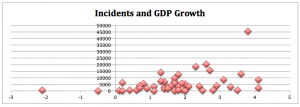
The best performing states, i.e. 10 states with the least incidents per point of GDP growth were (in order from least to most): Hawaii, Rhode Island, Delaware, Washington, D.C., Montana, Nevada, Massachusetts, South Dakota, Vermont, and Oregon.
The poorest performing states, i.e. 10 states with the most incidents per point of GDP growth were (in order from most to least): Kansas, Texas, Missouri, Illinois, Georgia, Iowa, Ohio, Mississippi, North Carolina, and Oklahoma.
Incidents and Population
Initially, it made sense that the total number of incidents would track with the state’s population. After all, with more people, you need more housing, and more services that are delivered through underground facilities, i.e. water, electricity, Internet, cable, and etc. However, our assumption was that these factors would be controlled for with incident rates. Theoretically, the incidents per 1,000 transmissions would account for the increased activity needed to service a larger population. As you can see below, while not a perfect correlation, an examination total incidents per state resident shows that there is, in fact, an identifiable trend line between total population and total incidents (with California at the bottom right being the major outlier).
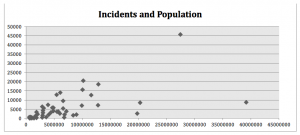
The best performing states, i.e. 10 states with the least incidents per person were (in order from least to most): Hawaii, Rhode Island, Alaska, Massachusetts, New York, Vermont, Connecticut, Nevada, West Virginia, and Virginia.
The poorest performing states, i.e. 10 states with the most incidents per person were (in order from most to least): Colorado, Missouri, Kansas, Georgia, Oklahoma, Iowa, Nebraska, Texas, North Carolina, and Indiana.
Cross Referencing Analyses
The analyses above allowed us to evaluate which states have the highest and lowest incident rates, the most and least incidents per point of GDP growth, and the most and least incidents per resident. All of these analyses measure different indicators, but there will still states that performed particularly well and particularly poorly across the board.
Rhode Island, Hawaii, Massachusetts, and Vermont were among the best performing states in all three categories.
On the other hand, Missouri, Iowa, North Carolina, and Kansas were among the worst performing states across all categories.
As could be expected, states with larger populations experienced more incidents. Six of the states with the highest incident rates also had the highest rates of incidents per person, but four did not. Further, California, which has by far the largest population in the country performed well across the other factors, meaning there is a correlation between population, transmissions, and incidents, but not a strong enough one to posit causation.
While we cannot draw any definitive conclusions from this analysis, we do have reason to further study which additional factors may be contributing to the success in Rhode Island, Hawaii, Massachusetts, and Vermont, and what may be needed to improve excavation practices in Missouri, Iowa, North Carolina and Kansas.
We will examine and analyze additional factors and data points in future editions of “Digging Deeper” on our constant quest to identify causes of excavation damage and how to make the process safer.