Measuring the Underground:
Advancing a New Estimate for the Total Linear Mileage of Buried Infrastructure in the United States
——————
Abstract

Trillions of dollars of infrastructure lie buried beneath our feet. From oil and gas pipelines for industrial use to household water, electric, and internet service, there are public and private utilities and service lines underneath nearly every corner of the country. Yet the most widely cited national figure for its total extent, 20 million miles, is more than 30 years old. In that time, fiber internet, grid modernization, water system expansion, and large-scale undergrounding for resilience have transformed the landscape. Still, no widely adopted, transparent modeling framework has replaced this legacy estimate, leaving policymakers, industry, and the public to rely on figures that likely understate current conditions.
Using three complementary approaches, bottom-up aggregation, state-level extrapolation, and historical growth projection, this report develops a modeling framework that produces updated national estimates accounting for public and private utilities, abandoned lines, and other systems. The result is a transparent modeling framework that produces central national estimates of approximately 50 million miles of buried infrastructure.
The implications extend across safety, planning, mapping, and infrastructure policy. A credible, modern estimate is more than a statistical update. It is a foundation for safer excavation practices, more effective 811 procedures, stronger asset mapping, smarter infrastructure planning, and targeted resilience programs. It can also encourage states, 811 centers, utilities, and infrastructure technology firms to develop localized estimates, publish higher-fidelity data, and collaborate toward a more transparent national understanding of buried infrastructure.
This modeling effort provides a structured alternative to legacy estimates and offers a foundation for further refinement. With data-driven clarity, a new era of informed infrastructure planning can lay the groundwork for safer, smarter, and more resilient communities in every state.
——————
Introduction
The modern American economy depends on an immense and largely invisible network of buried infrastructure crisscrossing the nation. In 2026, the nation will generate more than four trillion kWh of electricity, produce nearly five billion barrels of oil, and consume almost a trillion cubic meters of natural gas. More than 100 trillion gallons of water will move through treatment systems, and waste, sewage, and stormwater will pass unseen beneath communities. Telecommunications networks (telecom) will continue to expand, carrying data services to hundreds of millions of people. Every modern amenity relies on infrastructure that is constantly moving physical and digital commodities across the country.
Much of this system is deliberately hidden. Since the 1950s, utility companies have strategically pursued “undergrounding” to reduce visual clutter, improve reliability, and insulate critical assets from weather, vegetation, vandalism, and other hazards. The result is a growing share of pipes, cables, and wires beneath our feet in every corner of American life. When the extent of buried utilities is unknown and cannot be seen, every excavation carries the risk of striking an active line and endangering workers, the public, and other infrastructure. The “Damage Prevention” industry emerged to meet this challenge, emphasizing education, awareness, and mapping. One of its most enduring awareness tools has been conveying the sheer scale of what lies below. Recent data indicating elevated excavation damage incidents suggests that clearer and more current metrics may be necessary to support effective damage prevention efforts.
For more than 30 years, the most widely cited figure has been “20 million miles” of buried infrastructure in the United States. First presented at the National Transportation Safety Board’s 1994 damage prevention workshop and repeated in the 1997 NTSB report Protecting Public Safety Through Excavation Damage Prevention, the estimate became a foundational statistic for the Common Ground Alliance (CGA), the creation of the 811 system, and early federal efforts to systematize excavation safety. From there, it became embedded in federal safety literature and industry guidance, establishing it as the de facto national benchmark for excavation safety awareness. Even in 1999, the Common Ground Study noted that this figure had “likely dramatically increased,” an acknowledgment within U.S. Department of Transportation-sponsored research that the benchmark was already dynamic rather than fixed, yet the industry has continued to rely on it, with occasional subsequent references to an undocumented 35-million-mile estimate.
While the statistic proved durable and useful as an awareness tool, no publicly available documentation of the original 1994 methodology, assumptions, or uncertainty ranges appears to exist, leaving the benchmark widely cited but methodologically opaque. As a result, the benchmark has persisted for three decades without formal recalibration, methodological revision, or transparent updating.
Three decades of technological, economic, and demographic change strongly suggest that the original statistic likely understates the current scale of underground infrastructure. Population growth, natural gas expansion, the rapid undergrounding of electrical distribution, and the extraordinary rise in telecom, especially fiber, have structurally expanded the total buried network across nearly every major utility category.
In many regions, underground congestion has likely intensified even faster than linear mileage alone would suggest, as multiple utility systems now share increasingly dense corridors and rights-of-way, layering new infrastructure alongside legacy and abandoned lines.
Yet despite this transformation, and in the face of rising excavation damage trends, no structured, transparent, and nationally reconciled model has replaced the outdated benchmark. Utility owners continue to balance transparency with security, while fragmented data systems, inconsistent definitions, and a lack of digitalized mapping leave policymakers, excavators, and the public dependent on incomplete or ambiguous information. As undergrounding accelerates, and as new infrastructure is deployed for modern energy systems, artificial intelligence, broadband expansion, and resilience efforts, the absence of a credible national estimate limits effective planning and undermines excavation safety.
This study addresses that gap by revisiting the origins of the 20-million-mile benchmark, examining sectoral growth since 1994, and advancing multiple independent modeling approaches to produce a transparent and nationally reconcilable update. At the same time, we confront the inherent difficulty of measuring what is largely invisible. Publicly reported data capture only a fraction of what exists, and even companies themselves may not know the full extent of their assets.
But the need to advance the discussion is clear. Billions of dollars in annual damages, trillions in physical assets, and the safety of workers and communities all depend on understanding the infrastructure beneath us. This study offers a structured framework for approaching that challenge, moving beyond legacy estimates, acknowledging uncertainty explicitly, and providing a foundation for more rigorous research, better data, and stronger coordination across the damage prevention community.
By publishing assumptions, uncertainty ranges, and methodological detail, this framework is intended to support periodic recalibration rather than another generation of static citation.
Definition Scope Clarification
This study estimates the total linear mileage of all discrete buried or submerged pipes, cables, and wires occupying underground space in the United States. This includes public and private systems, service laterals, abandoned lines left in place, parallel facilities within shared rights-of-way, utilized conduit systems, and undergrounded segments formerly overhead. Individual fiber strands within a single cable sheath are not counted separately. The objective is to establish a comprehensive national total without double counting individual facilities, while recognizing that multiple discrete lines, including both active and abandoned assets, public and private, may occupy the same corridor. This definition is spatial and excavation-relevant rather than regulatory.
Results Summary
Across three independent methodological approaches, we find that the total linear mileage of buried infrastructure in the United States is substantially larger than the commonly cited legacy estimates. Bottom-up aggregation of publicly accessible data yields approximately 14 million miles, but this figure captures only documented systems and omits private, abandoned, and unmapped facilities, representing a significant undercount. State-level extrapolation models produce median national estimates between 41 and 47 million miles, with uncertainty ranges extending as high as 54 million miles. Historical growth projections anchored to the 1994 estimate of 20 million miles generate median estimates between 41 and 55 million miles, depending on modeling assumptions. Across models employing distinct but partially overlapping assumptions, central estimates consistently exceed 40 million miles, with several approaches clustering near 50 million miles for 2025. Taken together, these results indicate that previously cited national benchmarks are materially outdated and likely understate the current extent of buried infrastructure in the United States.
This study does not constitute a physical inventory, regulatory accounting, or GIS-based census of underground assets. It is a modeling exercise designed to bound plausible national totals under transparent assumptions.
Materials and Methods
Since 1994, the U.S. population has grown by 30%, while inflation-adjusted GDP has surged by over 120%. Basic infrastructure realities have changed substantially, particularly with the rapid expansion of broadband and fiber networks beginning in the early 2000s and continuing to accelerate today. Multiple indicators suggest that buried facility mileage has expanded substantially since 1994. Yet industry reports continue to cite outdated and unclear estimates.
The accuracy and scope of these earlier estimates remain unclear. We have not been able to uncover original datasets. No model details, ranges, or confidence intervals are provided with any of them. What types of utilities were counted? Was it an estimate only of public utilities or inclusive of private lines? Have abandoned lines been accounted for in the estimate?
To address these concerns, we undertake a modeling-based study to estimate the total linear mileage of buried pipes, cables, and wires in the United States for 2025 under explicitly stated assumptions. We employ the language from 1994 of “pipes, cables, and wires” and define that here to mean any and all facilities and service lines, whether public or private, including abandoned lines that are primarily buried or submerged. We aim to account for service laterals, irrigation lines, and conduit, everything facilitating the movement of power, water, waste, or other utility-like services anywhere underground in the United States. This is the broadest approach, because it emphasizes the extent of the built world beneath our feet and the implications for excavation work. A lack of standardized definitions across different resources adds to the difficulty of measuring this statistic.
To more accurately estimate the true mileage, we produced models within three independent approaches.
- The first approach builds an estimate from the bottom up. In this approach, we look for documented, published high-fidelity numbers on each utility type nationally and add them together. This is not a model, and underscores the need for modeling in subsequent approaches.
- Due to significant data gaps, this method is by far the least reliable and the most likely to represent a significant undercount.
- The second approach establishes relationships between key variables, such as high-fidelity data, for example pipeline mileage, and relates these to other variables like housing, population, population density, and GDP. These relationships are then applied in each state to form state-level estimates, which are summed to form a national statistic.
- This approach has the most promise for future research and can produce a transparent model, although more data is needed.
- The third approach takes the trusted 1994 statistics and applies growth factors to extrapolate to the present, utilizing statistics like population, housing, and GDP.
- While the simplest model, this provides an intuitive and clear picture of growth well within reason but does not capture all nuances and variables.
- Because the 1994 estimate cannot be independently reconstructed from original documentation, models that scale from it inherit its structural uncertainty.
We proceed in this task within three separate approaches in order to generate multiple models. This allowed us to begin testing which is most reliable and to produce a range of values. From there, transparent models will be advanced to the public sphere, which can be refined as more data is available or others can apply their own expertise.
Where direct measurement is unavailable, parameter bounds reflect comparative sector growth patterns, observed infrastructure density, and cross-model consistency rather than arbitrary selection.
Approach One: Addition of National Statistics From Reliable Sources
More than anything, this paper demonstrates a lack of consistent data, interchangeable definitions, poor coordination, and outdated estimates. Significant gaps in data lead to undercounting, as well as different ways of measuring. Starting with publicly available and industry-verified figures, we aggregated the miles of underground systems reported for each utility category. We draw primarily from government data, industry reports, and utility filings.
For each category, a standard deviation (SD) was assigned to represent uncertainty in the underlying data, adjusted based on the reliability of available sources. Each 95% confidence interval (CI) was then calculated as: Estimate ± 1.96 × SD

Although the total of roughly 14 million miles sounds extensive, it represents only the portion of infrastructure that is reported or estimable from public data, much of which is decades old. The confidence intervals do not account for the large share of buried infrastructure that is uncounted, unmapped, or undocumented, such as abandoned lines, private systems, specialized networks, and service laterals. Further, experts estimate that as much as 65% of all buried utility lines are private, while others remain either entirely unmapped or simply lack details for completeness.
For example, a recent Texas mapping effort identified approximately 1.47 million miles of mapped underground infrastructure but noted that nearly 90 percent of those mapped assets lacked verified material classification. Even within mapped datasets, documentation gaps remain substantial. Large-scale statewide mapping efforts already identify infrastructure on the order of one to two million miles within a single state, reinforcing that national totals materially below several tens of millions of miles are increasingly difficult to reconcile with contemporary infrastructure deployment patterns.
Independent state-level mapping efforts therefore reinforce both the scale and the uncertainty of buried infrastructure inventories, underscoring the need for structured modeling approaches such as those presented here.
Because no dataset fully captures these hidden systems, subsequent modeling necessarily relies on structured assumptions and comparative inference. For instance, we can predict there are around a million additional miles of flow lines for oil and gas wells if we assume one mile of pipeline per well. If a conservative 75% of U.S. homes have an average of 50 feet of underground electric, gas, water, or other service laterals, that adds over two million additional miles. A study at Iowa State University found that a Subsurface Utility Engineering investigation uncovered 78% more underground infrastructure, by linear footage, than was in state 811 center records. Similar results can be found in other investigations.
This analysis should not be mistaken for a formal model. The confidence interval is included to demonstrate uncertainty, but the data gaps, guesswork, and inconsistent reporting make this estimate merely a demonstration of the weaknesses in data collection.
Taken together, these omissions and undercounts suggest that the 14 million mile aggregation reflects documented systems only and likely materially understates the total buried infrastructure network. Based on the magnitude of documented omissions and illustrative adjustments, plausible totals under this framework extend materially beyond 35 million miles.
Approach Two: State-Level Extrapolation
Where national data is limited or inconsistent, state-level data provides another lens. This approach is straightforward: if we can reliably estimate the mileage of individual states, we can aggregate these estimates to generate a more informed national picture. This method offers both a cross-check on national statistics and a way to account for regional differences.
Model 2A: State Gas Pipeline to Total Infrastructure Scaling
We begin with PHMSA’s official state-by-state data on gas pipelines. This includes transmission, distribution, gathering, and service lines regulated by PHMSA. Gas pipelines are among the most reliably documented underground assets, providing a solid baseline.
We applied scaling assumptions: gas pipelines most likely constitute five to seven percent of the total underground network of pipes, cables, and wires, reflecting the decline from roughly 10 to 12 percent in 1994 as non-gas systems have expanded at faster rates. We then applied a Monte Carlo simulation at the state level, a technique that estimates uncertainty by running random trials to show how results vary when input assumptions change. By sampling with different percentages, we account for the fact that pipelines may in fact represent a slightly higher or lower share. For each state, 1 million random gas share values were drawn uniformly from 0.05 to 0.07, and the total underground infrastructure for that state was estimated by dividing the state’s reported gas pipeline mileage by the sampled share.
This model produces a median national estimate of 46.7 million miles, with a 95% confidence interval of 45 million to 48.4 million miles.
We know different utilities have scaled at different rates, so using pipelines provides a conservative figure. For the most part, we expect gas to be similar to the rate of growth of other common industrial, household, and business service lines like water, waste, and electric. Other lines, like fiber optic cable, have grown at far faster rates, necessitating additional modeling.
Model 2B: State-Specific Scaling
To avoid relying on national ratio assumptions between gas pipelines and total buried infrastructure, we selected a state for which detailed, comprehensive underground utility data was publicly available. This approach relies on identifying a benchmark state that represents a mix of urban and rural characteristics, so that its data can be scaled to produce a rough but reliable national estimate.
Ohio was selected as the primary benchmark state because the Public Utility Commission of Ohio (PUCO) maintains detailed, relatively complete infrastructure data. Through public outreach and independent research, we reached a conservative estimate for the total linear mileage of buried infrastructure in Ohio. The state is used as a heuristic benchmark because its urban-rural composition and population mix are broadly comparable to national averages, though no single state can fully represent national heterogeneity.
From this foundation, we assume that measurable relationships between infrastructure and state-level characteristics, population, housing units, GDP, land area, and urbanization, can be used to estimate unknown infrastructure mileage across states through proportional scaling. Logically, more housing units necessitate more underground infrastructure to connect utilities like water, sewer, telecom, and gas. Likewise, the number of people and population density will have an impact on underground infrastructure as well.
Each variable captures a distinct driver of network extent: population and housing units reflect service demand and density; GDP represents economic activity and infrastructure intensity; land area indicates spatial coverage; and urbanization measures the concentration of utilities in developed areas. Housing units, in particular, directly translate to service connections and physical network extensions, as each new unit requires distribution links to reach it. We therefore construct a ratio-based extrapolation model:

To assess uncertainty in both the Ohio baseline and the state-specific scaling, we again used a Monte Carlo simulation with 1,000,000 random draws. Each simulation incorporated the following.
- Uncertainty in the Ohio baseline: Instead of assuming a normal distribution, we used a uniform distribution between 600,000 and 800,000 miles to reflect equal plausibility across that range.
- Variable influence: We applied Dirichlet weights to the five state-level variables, population, housing units, GDP, land area, and urbanization, assigning heavier weight to variables more strongly correlated with known underground mileage patterns.
- Residual variation: A plus or minus 15% multiplicative residual was included to capture unobserved differences in infrastructure patterns between states.
The median national estimate is 40.9 million miles, with a range of 29.8 to 54.5 million miles reflecting combined uncertainty of the Ohio baseline, state-level scaling, and residual variation.
Approach Three: Historical Growth Projection
The third approach builds on historical data to project the growth rate of underground infrastructure over time. Rather than relying solely on current measurements or state-level extrapolation, this method uses past estimates, trends in utility expansion, and known investment patterns. Historical growth projection provides a complementary perspective and a conservative estimation of how the nation’s buried networks have evolved since the widely trusted 1994 baseline of 20 million miles.
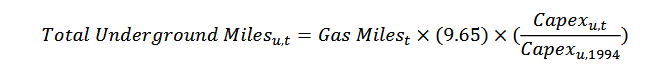
Model 3A: Gas to Total Scaling, Gas and Utility CapEx Indexing
The 1994 estimate suggested that the total underground utility mileage was roughly 10 times, or 9.65 times, the miles of gas pipelines, including public distribution, transmission, service, and gathering. Using this ratio as a starting point, we multiply annual gas pipeline mileage by the 1994 ratio and scale the result according to how much each major utility sector, telecom, electric, and water, has expanded relative to 1994.
To account for uncertainty in the 1994 benchmark itself, we apply a plus or minus 10% range around 9.65. This produces a baseline interval of 8.69 to 10.62, which defines low, central, and high scenarios for the initial scaling from gas mileage to total underground mileage. For each sector, we construct a simple physical growth factor equal to its capital-expenditure index, meaning CapEx in year t relative to CapEx in 1994. Each sector then produces its own mileage estimate by multiplying gas mileage by the 1994 ratio and its sector-specific index:
This yields three independent trajectories:
- Telecom-based estimate: ~49–54 million miles (reflecting rapidly growing broadband and fiber investment)
- Electric-based estimate: ~22–61 million miles (wide range due to uncertainty in how much CapEx produces new underground mileage)
- Water-based estimate: ~33–36 million miles (gradual but steady capital growth)
The true mileage likely lies somewhere within these scenarios, but the model has structural limitations. Because CapEx does not map one-for-one to linear mileage, and because we lack reliable historical information on how much of the non-gas system belonged to telecom, electric, or water in 1994, we cannot combine the three trajectories into a single weighted estimate without imposing arbitrary assumptions. Capex also includes replacement spending and major above-ground investments, which weakens its relationship to physical expansion, particularly for electric and local gas distribution systems.

The median national estimate is approximately 41 million miles, with a range from 21 million miles to 61 million miles. While informative, this approach generates parallel sector-based scenarios rather than a unified structural estimate of total buried mileage.
Model 3B: Gas to Total Scaling Gas and Utility Capital-Stock Value Indexing
Capital expenditure may not scale with linear miles perfectly. Across utilities, a linear mile likely has notable differences, so we instead conduct a similar analysis as above with the capital-stock value of the assets themselves.
The Bureau of Economic Analysis (BEA) maintains detailed records on the stock value of private assets for each industry, including structures. We used BEA data from 1994 to 2024 for “Current-Cost net Stock of Private Structures by Industry,” a normalization across years accounting for asset value and inflation.
While imperfect, as “structures” includes infrastructure other than pipelines and buried utilities, this approach represents a separate, indirect method of measuring overall industry growth, which can help refine estimates to buried infrastructure and capture areas other models miss.
Building on that foundation, Model 3B begins with the same 1994 benchmark of 20 million miles (9.65× gas miles) and uses gas mileage as the physical anchor. Total underground mileage in later years is then scaled according to reported value expansions in the telecom, electric, and water sectors relative to 1994. To correct for the shortcomings of Model 3A, several additional layers are introduced:
First, each utility receives a physical-growth factor equal to its capital-stock index raised to an elasticity. Because asset values tend to grow faster than actual route miles, the elasticities reflect the fraction of asset growth that plausibly translates into buried mileage. They are sampled using triangular distributions (telecom: 0.25/0.30/0.40; electric: 0.20/0.25/0.35; water: 0.05/0.10/0.15).
Second, the composition of the underground network in 1994 is unknown. We model the 1994 mix as a distribution centered on a plausible allocation – 55% telecom, 35% electric, 10% water – and sample weights using a Dirichlet distribution. This produces realistic uncertainty bands for the share of each utility in the 1994 baseline while ensuring weights sum to one.
Third, BEA capital-stock data covers only the private portion of each sector, and different utilities place very different proportions of their assets underground. To avoid systematic undercounting, we apply both an ownership-correction factor (to scale from private to total assets) and an underground-share factor (to restrict results to buried infrastructure only). Telecom is almost entirely private and mostly underground; electric is roughly two-thirds private and only partially underground; and water is almost entirely public and almost entirely underground.
Putting these components together, total underground mileage in year t is calculated as:

Where each 𝐺𝑢 incorporates (a) growth in capital-stock value since 1994, (b) the sampled elasticity, (c) the ownership correction, and (d) the underground share.
A Monte Carlo simulation with one million iterations combines all sources of uncertainty, with the analysis concluding with data year 2024.
The median national estimate is roughly 49.76 million miles, with a range from 35.79 million to 68.88 million miles.
Model 3C: Simple Extrapolation
A more straightforward method uses linear and exponential extrapolation between known historical benchmarks. Using the previously cited estimates: 20 million miles in 1994 and 35 million miles in 2012, we calculate average annual growth under two assumptions:
- Linear extrapolation assumes a constant absolute increase of roughly 0.83 million miles per year, yielding an estimated 46 million miles in 2025.
- Exponential extrapolation assumes a constant percentage growth rate of about 3.1% per year, reflecting accelerated investment and technological adoption, yielding approximately 52 million miles in 2025.
To capture uncertainty, both methods incorporate variation in the historical data and growth parameters: the 1994 base value is adjusted by ±10% (18 to 22 million miles) and the 2012 benchmark by ±15% (29.75 to 40.25 million miles).
- Under linear extrapolation, these adjustments generate a 2025 range of roughly 35 to 56 million miles.
- Under exponential extrapolation, they produce a 2025 range of roughly 43 to 67 million miles.
This simple approach, while less granular, reinforces the conclusion that total underground infrastructure has expanded dramatically over the past three decades. Because historical figures may not fully capture private, abandoned, or unmapped systems, the true mileage is likely higher.
The median national estimate from these two approaches is roughly 50 million miles, with a range from 35 million to 67 million miles.
Results


Discussion
Model Conclusion
The range produced by the various models with independent approaches extends from 21 million to 69 million miles. We used wide confidence intervals and, where possible, conservative assumptions. The point estimates generated were between 41 million and 55 million miles. Together, these findings indicate that the 20 million and 35 million mile statistics no longer represent accurate benchmarks.
Across three independent methodological approaches, central estimates consistently cluster near 50 million miles for 2025. Given the clustering of independent model results between 41 and 55 million miles, with the densest overlap centered near 50 million, we select approximately 50 million miles as the most defensible current national benchmark for total buried infrastructure in the United States.
This figure should be interpreted as a modeled central tendency derived from transparent assumptions rather than as a physical inventory count. Nevertheless, given documented sector growth and cross-model consistency, legacy figures of 20 million or 35 million miles no longer reflect contemporary infrastructure conditions. Totals materially below this level would require growth dynamics inconsistent with multiple independent modeling approaches presented in this study.
Because infrastructure deployment remained elevated through 2025, the central benchmark presented here reflects contemporary conditions and is unlikely to overstate current underground infrastructure scale under prevailing growth trends. Independent replication using multi-state subsurface audits, anonymized utility asset aggregation, and academic review would materially strengthen future iterations of this estimate.
Model Limitations
Significant research led to the conclusion that exact mileage figures may not even be known by the various utility and asset owners themselves, so modeling from different angles is most likely to help form a true representation. Not only is consistent terminology difficult to find, but collecting quality data and reporting it is a challenge within single industries. In 2013, the Edison Electric Institute released an updated report for the undergrounding of power lines, even noting that within the industry, “it has been determined that miles-of-line reporting was not consistent enough from year to year to be useful in presenting a clear discussion on the topic.”
Even advanced AI-assisted mapping platforms acknowledge incomplete visibility into buried infrastructure. This underscores that any contemporary national estimate, including the one presented here, must be understood as a modeled approximation rather than a physical census. Each model relies on indirect inference from observable sector indicators.
These kinds of limitations make it all the more challenging to reconcile across multiple industries into a single cohesive “utility” estimate. The conclusion advanced in this article is a modeled estimate informed by the range produced across independent approaches.
The modeling results presented here indicate that the legacy 20 million and 35 million mile statistics no longer reflect contemporary infrastructure conditions, despite their continued use by industry participants and policymakers. Observed sector growth over the past three decades makes clear that those figures are outdated as national benchmarks. At the same time, this study does not constitute a definitive census of total linear mileage. Instead, it advances a structured and transparent benchmark that can be refined as higher-fidelity data and improved reporting become available.
We utilized three approaches to generate broad estimate ranges. Approach One largely suffers from lack of high quality and up-to-date data, but this approach is most likely to yield reliable results in the future with better mapping and record keeping. Standardized definitions and clear categorization are also needed to improve this approach, with basic clarity on terms like “public utility” and “private lines” still needed across industry, government, and academic literature. Approach Two uses relationships between variables to extrapolate total buried mileage, but those relationships may vary by state with different legal, economic, and even cultural dynamics. Major federal initiatives like hydrogen hubs, electrification/renewables, and broadband deployment, alongside industry trends like undergrounding goals will inevitably change the rates of growth of individual utility types by region and across time. Approach Three largely depends on the accuracy of the 1994 estimate of 20 million miles and therefore is built on somewhat of a black box. It could be a solid foundation, but it may have been over or underestimated at the time, and standardized definitions and variables included cannot be validated.
While this estimate represents the most structured and transparent update to date, future empirical validation and data improvements may refine the benchmark over time.
Implications for Stakeholders
This study offers value across many industries, even if its immediate application is narrow. Its most direct relevance lies in the damage prevention community, where a clearer understanding of total buried mileage can advance excavation safety and reduce service disruptions.
Education. Public awareness remains essential. Every excavation risks damaging buried facilities, and conveying the true – often incomprehensible – scale of underground utilities reinforces why notifying 811 matters. Updating the standard mileage figure strengthens this educational mission.
Research Practices. Outdated data should not drive current decisions. One purpose of this study is to retire the decades-old 20-million-mile statistic and advance a more accurate benchmark. Publishing transparent models provides the foundation for future updates, improved accuracy, and complementary research.
Mapping. This effort underscores the urgent need for better mapping and digitalized recordkeeping. The estimate presented here depends on assumptions and modeling because comprehensive records do not exist. Utilities should prioritize creating and digitizing accurate facility maps. With modern tools and aggregated 811 data, producing a national estimate could be straightforward within a decade. Enhanced mapping will reduce unproductive activity, while improving locating and excavation safety.
Partnerships with technology firms – particularly those using AI to reconcile legacy data – will strengthen industry-wide understanding of risks and opportunities. While disagreement remains regarding legacy facilities almost everyone agrees on one thing: Newly installed underground facilities should be mapped.
Modeling and Growth Projections. Transparency in modeling is essential. The original 1994 methodology for the 20-million-mile estimate cannot be found, nor can the basis for later 35-million-mile references. Publishing multiple approaches enables future refinement. As federal funding, state regulation, corporate risk management, and infrastructure planning increasingly rely on sound growth projections, this work contributes a needed analytical framework.
Security, Risk, and Resilience. Identifying what exists underground – and where – is the first step toward protecting it. As digitization and GIS tools advance, cybersecurity risks will increase alongside the benefits of better mapping. The resilience value outweighs the risks, but stakeholders must be alert to both. This and later research can help utilities, governments, and private operators protect critical assets, assess vulnerabilities, and strengthen national resilience.
Public Policy. Updated data can support smarter dig laws and project planning. Policies such as “dig once” requirements and default colocated utility corridors can significantly reduce long-term congestion and damage risks. Greater colocation also enables joint monitoring and protection of assets, including through distributed fiber-optic sensing and related technologies.
Conclusion
The United States sustains one of the world’s most advanced economies through trillions of dollars of infrastructure assets, a substantial share of which lies buried out of sight. Because these pipes, cables, and wires are hidden, their true scale is often overlooked, creating persistent risks when new infrastructure is built and exposing homeowners and excavators to danger every time ground is broken. Yet the modern economy depends on this underground network. Water, electricity, data, waste, gas, and hazardous liquids move beneath our feet across nearly every community, and the damage prevention industry – anchored by the 811 process – works daily to prevent accidents. Still, the industry has not maintained or published comprehensive data on how expansive this network has become.
This study advances a structured benchmark toward addressing that gap. The estimate reflects modeled uncertainty and will benefit from continued refinement as data quality improves. But the evidence is clear: the nation’s buried infrastructure is far larger and more complex than widely understood and requires ongoing investment, mapping, and protection.
Using three complementary methodological approaches and incorporating observed sector growth, our modeling supports a central benchmark of approximately 50 million miles for total buried infrastructure in 2025.
Understanding this scale is essential for future planning and for advancing a safer, more resilient infrastructure system. As infrastructure deployment accelerates, maintaining and periodically updating this benchmark will be essential to ensure excavation safety, infrastructure planning, and risk management reflect contemporary conditions. Continued collaboration among utilities, regulators, and technology providers will be critical to improving data quality, strengthening excavation safety, and protecting the communities and industries that depend on this vast subterranean network.
Acknowledgements
The authors gratefully acknowledge the work and assistance of Mr. Colson Grimes, Mr. Albert Bernhardt, Ms. Emma Kelliher, Mr. Minxing Liu, Ms. Nagomi Katano, Mr. Patrick Conrad, Mr. Trevor Mathia, and Mr. Daryoush Jamkhu in helping to prepare this paper.
Additionally, this report benefited from review by external subject-matter experts. Any errors remain the responsibility of the authors. We thank our expert and peer reviewers.
Authors
Benjamin Dierker, JD, MPA
Executive Director, Alliance for Innovation and Infrastructure
Owen Rogers
Public Policy Associate, Alliance for Innovation and Infrastructure
Jackson Murray
Public Policy Intern, Alliance for Innovation and Infrastructure
For more information or inquiries on this report, please contact the Aii Media Coordinator at info@aii.org
The Alliance for Innovation and Infrastructure (Aii) is an independent, national research and educational organization working to advance innovation across industry and public policy. The only nationwide public policy think tank dedicated to infrastructure, Aii explores the intersection of economics, law, and public policy in the areas of climate, damage prevention, eminent domain, energy, infrastructure, innovation, technology, and transportation.