Introduction
 The railroad industry has a history of changing its labor and capital inputs to maximize safety and efficiency in light of evolving operational needs and regulatory frameworks. In the early years, large crews performed everything from manual braking to shoveling coal. Over time, technology and operations evolved to automate certain roles to improve efficiency and remove people from dangerous positions. Importantly, new technology and tools have always empowered and reshaped railroad employees’ roles. As new technologies are developed, tested, and implemented at scale, natural operational realignments often find tension with regulation.
With high-profile accidents, major lawmaking efforts, and collective bargaining disputes in recent years, even incremental changes to railroad operations can generate controversy and disagreement. Given rail’s importance to the national economy and supply chain for critical industries, these issues demand independent and data-informed analysis.
In recent years, Aii has offered independent analysis of several such issues, including safety data on crew sizes, train length, and track inspection technologies.[i],[ii],[iii] In April 2025, Aii explored the underlying regulatory framework further on the issue of inspections in Driving Regulatory Innovation for Safer Railroading, which examines how the Federal Railroad Administration’s (FRA) regulatory structure and waiver process could either facilitate or hinder the adoption of new railroad safety technologies.[iv] Automated Track Inspection (ATI), a broad term used to capture multiple types of automated technology-based inspection applications, served as the central case study of the report. Since then, the FRA has approved a five-year national waiver allowing qualifying railroads to combine regular ATI inspections with modified visual inspection schedules under specific observed safety conditions.
The debate over ATI has raised questions about how different technologies and inspection methods should be properly integrated into safety measures. Existing regulations usually prescribe inspection rules, so testing a different balance between visual and technology-based inspection generally requires a specific waiver from the FRA. New, automated technology systems can measure specific conditions more frequently and precisely than conventional inspection and during normal railroad operations. However, these automated systems do not perform every function of human track inspectors, nor are they intended to.
This report uses FRA accident data to examine the most frequent and consequential type of rail accident: derailments. It helps place claims about labor, technology, and inspection practices in context for policymakers evaluating reforms for safer railroading.
Competing Perspectives of ATI Potential
Federal track safety regulations have historically relied heavily on visual inspection. Under 49 C.F.R. § 213.233, railroads must inspect track at specified frequencies, generally through visual examination conducted on foot or from a vehicle.[v] Various technologies have developed alongside that framework, particularly Track Geometry Measurement Systems (TGMS), which precisely measure conditions such as track gauge, alignment, curvature, and elevation. The underlying technology is not new: track geometry cars were first developed in the 1920s and have evolved from early analog instruments into the digital, laser-based systems used today.[vi] TGMS tools are often present in hi-rail inspection vehicles seen traversing railway lines.
More recently, modern railroad operators have spent years testing autonomous TGMS systems (sometimes called ATGMS) for identifying track-geometry defects during regular train operations by installing the technology on a rail car or locomotive. ATI is an umbrella term used by the FRA to describe autonomous TGMS and other track-measurement technology.[vii] By measuring track geometry each time an ATI-equipped train passes on mainline track, railroads are aiming to improve safety and reduce the frequency of less-efficient visual inspections. When ATI identifies a geometry defect, the system records its location and severity so the railroad can respond, which may include slowing or restricting traffic and dispatching maintenance crews to inspect and, if needed, repair the problem before it worsens into a derailment risk.
However, ATI is not a complete replacement of visual inspection, which remains necessary for spotting certain physical hazards, recognizing developing problems, and evaluating conditions that automated measurement systems are not designed to capture.
While the deployment of ATI technology does not itself conflict with existing regulations, testing fully autonomous TGMS schedules and reducing visual inspection frequencies requires temporary, railroad-specific waivers issued by the FRA. BNSF test data showed ATI systems identifying track-geometry defects at rates more than 200 times those of traditional visual inspections.[viii] From the railroad perspective, interested in the best use of available resources to drive gains in safety and efficiency, this has become a key statistic and example of the power of ATI systems.
The path toward a nationwide ATI waiver was neither quick nor straightforward. Beginning in 2018, the FRA approved multiple ATI test programs for nearly every Class I railroad, allowing them to evaluate automated TGMS inspection alongside reduced visual inspection schedules. After initially approving and extending several programs, the FRA later denied requests to continue or expand ATI.[ix] This prompted a multi-year legal battle. The Fifth Circuit vacated FRA’s denial in 2023, and after the agency denied the request again, ruled in 2024 that the decision was “arbitrary and capricious” and ordered the FRA to expand BNSF’s waiver.[x],[xi] FRA proposed a separate rule in 2024 that would require greater use of TGMS without reducing existing visual inspection requirements.[xii]
Against this contentious backdrop, the FRA issued a nationwide waiver for ATI systems in December 2025. This new five-year waiver, requested by the Association of American Railroads (AAR), allows any qualifying railroad to reduce certain visual inspections while conducting automated geometry inspections, subject to various conditions, reporting requirements, detection thresholds, and satisfactory equipment.[xiii] Early results have begun to generate meaningful data. As of September 2026, Union Pacific reported zero track-caused derailments across the territories operating under the ATI waiver.[xiv]
During a June 2025 hearing of the U.S. House of Representatives Transportation and Infrastructure Committee, Subcommittee on Railroads, Pipelines, and Hazardous Materials, Aii presented findings from the Driving Regulatory Innovation for Safer Railroading report as lawmakers considered the future of railroad safety technology and the FRA’s waiver process.[xv] While the hearing would be an important step towards the eventual December 2025 Waiver, it also highlighted disagreements over the effective scope of ATI.
While representatives of railroads advocated that ATI improved safety outcomes, President Tony Cardwell of the Brotherhood of Maintenance of Way Employes Division (BMWED) cautioned that the proposed cut in inspections would be dangerous and that technology was not completely capable of filling that role. His articulation best summarizes the labor-focused concern over inspection types and outcomes:
ATI is a machine run over railroad tracks that detect one type of track defect: track geometry defects. Track geometry refers to the geometric properties of the track, including how wide the track is (track gauge) and any curvature of the track. These track geometry defects account for just six of the 23 defects FRA requires railroads to inspect.
ATI cannot detect defects like broken rails, rotten ties, washouts where the track has washed away, or obstructions in the right of way. ATI can only detect 26 percent of what a human track inspector can detect and, therefore, cannot replace human inspections. Moreover, ATI only detects defects, while track inspectors identify problems before they become defects.
The Brotherhood is right that automated geometry systems cannot replace the full scope of human visual inspection, and accident data cannot capture hazards inspectors successfully identify and correct before failure. But ATI can identify developing geometry conditions at far greater frequency and scale, allowing human inspectors and maintenance crews to focus their expertise on verifying, prioritizing, and correcting problems before they become critical. In practice, ATI creates an opportunity for technology to expand detection while people remain responsible for diagnosis, judgment, and repair. The more relevant question, then, is: if ATI detects only a subset of the defects inspectors are responsible for identifying, how significant is that subset in practice?
The “six of 23 defects FRA requires railroads to inspect” statistic is based on regulatory requirements within 49 C.F.R. Part 213.[xvi] It provides a basis for explaining the scope of automated geometry in regulatory inspection terms, but does not measure how frequently the different defects occur or how often they contribute to accidents. It is a regulatory requirement, and does not easily translate to FRA Cause Codes or represent any measure of actual effectiveness.
The 23 categories are also not necessarily independent measures of track condition. Some conditions outside the Track Geometry category, such as deteriorated ties or ballast, can ultimately manifest as measurable geometry problems. ATI may not identify the underlying component defect itself, but it can detect the change in track performance.
For instance, § 213.103 governs ballast and is counted as a Track Structure provision.[xvii] Yet the FRA classifies “disturbed ballast section” and “insufficient ballast section” as Track Geometry accident cause codes. These differences make a simple count of regulatory provisions an incomplete measure of the real-world significance of track geometry defects and the tools used to measure them.
Comparing regulatory provisions, FRA cause codes, and actual reported primary-cause derailment data provides three different perspectives on its importance.
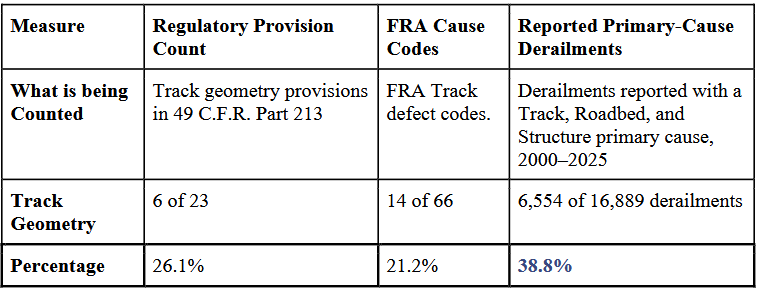 Table 1, Track Geometry in Regulation and Derailment Data[xviii],[xix]
Six out of 23 describes the percentage of defect categories in BMWED’s framework that is associated with track geometry.[xx] It does not show that track geometry represents only 26 percent of actual track defects, 26 percent of derailments reported with a Track, Roadbed, and Structure primary cause, or 26 percent of the safety risk addressed through track inspection. Additionally, within the 26 percent that both ATI and inspectors can detect, the BNSF study provides potential evidence that in practice, ATI can detect orders of magnitude more potential defects than visual inspection. Only by looking at actual safety data can regulators and policymakers get a clearer picture of regulations, technology integration, and how to best move forward.
Analyzing FRA Accident Data
To examine how these categories translate into actual incident and safety outcomes, Aii analyzed FRA Form 54 Rail Equipment Accident/Incident Data for unique accidents occurring from 2000 through 2025.[xxi] These are the result of accidents, not caught and addressed defects, which also require investigation through data held by railroad companies and labor unions.
Accident types vary significantly in relation to track inspection. Collisions, fires, and highway-rail crossing accidents will often occur for reasons largely unrelated to track condition or even outside of what inspectors are looking for. Derailments, by contrast, represent more than two-thirds (67.9 percent) of all Form 54 incidents examined and are often track condition and inspection related. Track, Roadbed, and Structure represents the largest reported primary-cause family for derailments. Within that subset, Track Geometry – the category directly measured by TGMS and other automated geometry systems – is the largest reported primary-cause category.
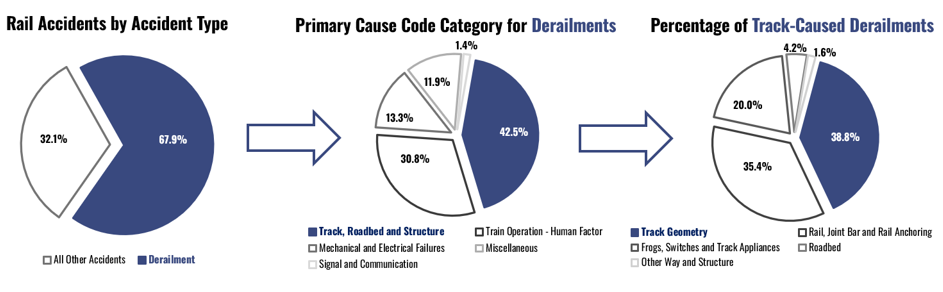
Figure 1, Track Geometry Within the Broader Derailment Picture, 2000–2025
Track, Roadbed, and Structure codes were the leading reported primary-cause family for derailments in the dataset, accounting for 16,889 incidents, or 42.5 percent of all derailments.[xxii] Human factors were the second-largest at 30.8 percent, followed by mechanical and electrical failures at 13.3 percent.
Track inspection primarily concerns “Track, Roadbed, and Structure.” Within derailments reported with Track, Roadbed, and Structure as the primary cause, Track Geometry was the largest individual primary-cause subcategory. Track Geometry accounted for 6,554 derailments, or 38.8 percent of derailments reported with Track, Roadbed, and Structure as the primary cause, followed by Rail, Joint Bar, and Rail Anchoring at 35.4 percent.
These results are notable because they show that track-related conditions and track geometry each have an outsized role in reported derailments. The regulatory provisions or cause codes associated with a condition do not indicate how frequently that condition was reported as the primary cause of an accident.
Track Geometry may represent just 14 of FRA’s 66 cause codes for Track, Roadbed, and Structure, yet it accounted for nearly 40 percent of derailments reported with a Track, Roadbed, and Structure primary cause in the dataset. Of the 6,554 derailments reported with Track Geometry as the primary cause from 2000 to 2025, 6,307, or 96.2 percent, were attributed to cause codes reflecting geometry conditions measurable by TGMS.
This does not mean TGMS would necessarily have detected or prevented each of these derailments, nor that automated systems catch a majority of overall defects – visual inspections remain essential for non-geometry issues – but it does put the earlier “six of 23” statistic in context. While Track Geometry accounts for only 26 percent of the provisions identified by BMWED, the conditions covered by automated geometry measurement represent the largest category among derailments reported with a Track, Roadbed, and Structure primary cause.
Trend Assessment
An interesting exercise is to look at the trends in accident data over time. With prescriptive regulations being in place for decades but technology becoming more sophisticated and implemented at larger scale over time, there are natural questions to explore about the causal relationships.
While derailment rates have declined significantly over time, derailments reported with Track, Roadbed, and Structure as the primary cause have declined faster than overall derailments – the primary-cause family within which ATI systems are calibrated to identify issues.

Figure 2, Annual Derailments per Million Train Miles by Primary Cause Family, 1975–2025[xxiii]
Zooming out to encompass all available FRA Form 54 data, the rate of reported derailments has declined significantly over the past 50 years, from a peak of 11.65 derailments per million train miles in 1978 to 1.61 in 2025.[xxiv] Even since the turn of the century, derailment figures have fallen significantly.
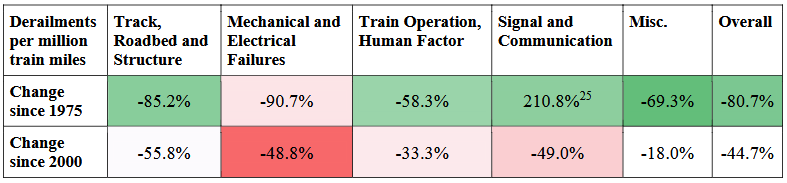 Table 2, Change in Derailments Per Million Train Miles by Reported Primary-Cause Category[xxv]
Track, Roadbed, and Structure derailments have declined by 85 percent since 1975, and 55 percent since 2000, outpacing overall derailment decline in both periods.
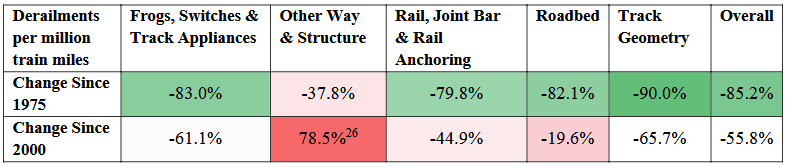 Table 3, Change in Track-Primary-Cause Derailments Per Million Train Miles by Subcategory[xxvi]
This coincides with increased use of advanced TGMS and other technology. Since the 1990s, TGMS has progressed toward more precise optical and laser measurement, real-time data processing, higher-speed inspection, and ultimately autonomous systems capable of collecting geometry data much more frequently during regular train operations.[xxvii] Form 54 data alone cannot establish how much these technologies contributed to the decline, which also reflects improvements in maintenance, operations, infrastructure, and other practices. However, because the decline in derailments reported with Track, Roadbed, and Structure as the primary cause has outpaced all other primary-cause families since 2000, the trend is consistent with a contribution from increasingly sophisticated track-inspection technologies, and there is likely reason to believe integration of ATI systems has some explanatory power. Likewise, derailments reported with Track Geometry as the primary cause have declined faster than those of all other categories within the Track, Roadbed, and Structure family.
More is needed to determine both a causal relationship and the statistical strength of that relationship. The data were normalized by total train miles, but other variables not measured include the number of inspectors. Additionally, among Class I railroads specifically, ton-miles per system mile have increased roughly four-fold (approximately 3.9 million to approximately 16.8 million) over the period from 1975 to 2022.[xxviii],[xxix] Many variables are present, with two consistent throughlines: systemic use of technology has increased, while the rate of reported derailments per million train miles has decreased substantially.
As regulation locks in certain technologies or practices through prescriptive rules, it risks limiting productive rebalancing of labor and capital on specific lines for particular operational contexts. Enabling performance-based practices that can maximize the safety outcomes should be the goal.
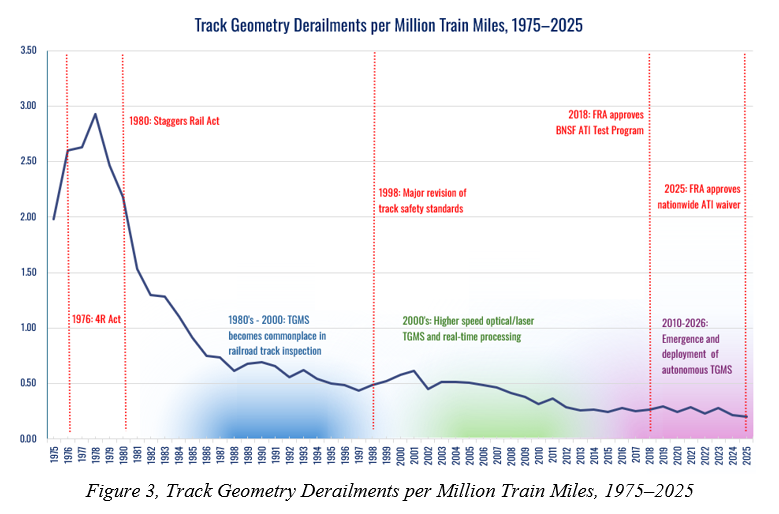
Figure 3, Track Geometry Derailments per Million Train Miles, 1975–2025
Conclusion
By the derailment measures examined here, railroad safety has improved substantially over the last half century. Despite high-profile derailments, crew size debate, train length concerns, and political disagreement, FRA data show a substantial long-term decline not only in the number of reported derailments, but also in derailments per million train miles. The exact causal explanation is difficult to isolate but likely reflects investment in technology, improved maintenance, and the ability to revise and rebalance operational details to fit the latest context.
Despite remarkable gains over the past 50 years, FRA data show that derailments remain the most frequent type of rail accident and one of the clearest opportunities for technological and regulatory reform. Track, Roadbed, and Structure is the largest reported primary-cause family for derailments, and Track Geometry is the largest reported primary-cause subcategory within that family. This places ATI squarely in one of the most important areas for safety improvement.
By investing in autonomous tools that can measure track conditions frequently and precisely during normal rail operations, ATI has the potential to improve safety while making inspection practices more efficient. As inspection technology continues to advance, effective regulation should focus on measurable performance and allow operational practices to evolve when data demonstrates that new approaches can improve safety outcomes.
Appendix
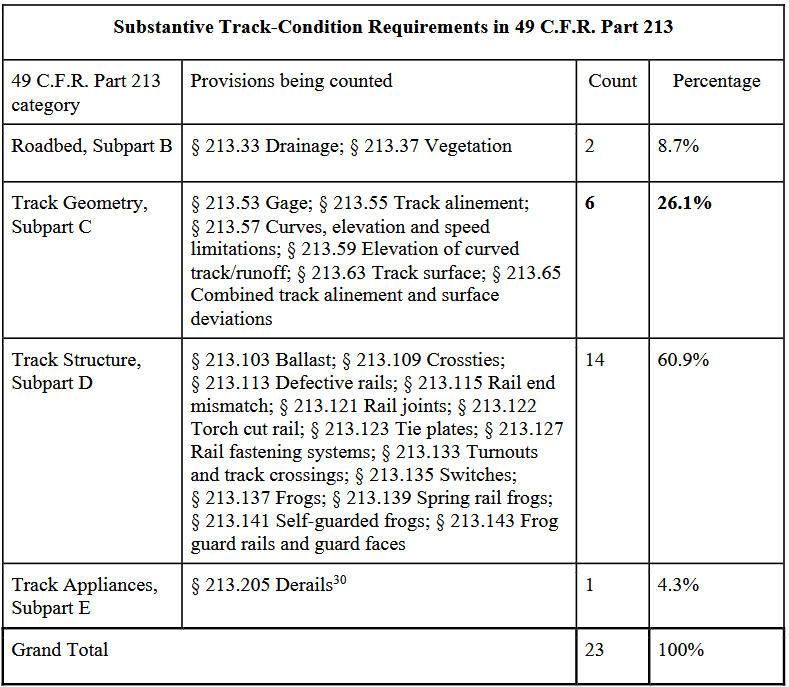 Table 4, Substantive Track-Condition Requirements in 49 C.F.R. Part 213[xxx]
Citations
[i] Dierker, B. (2022, December). The Safety Impact of Technology and Crew Size: An Analysis of Accident Data, Incorporation of Technology, and Train Crew Staff Levels on Rail Safety Trends. Alliance for Innovation and Infrastructure. https://www.aii.org/wp-content/uploads/2022/12/The-Safety-Impact-of-Technology-and-Crew-Size.pdf.
[ii] Dierker, B. (2023, August). Evaluating Train Length: Mitigating the Costs and Enhancing the Benefits of Longer Trains. https://www.aii.org/wp-content/uploads/2024/01/Evaluating-Train-Length.pdf.
[iii] Dierker, B. & Rogers, O. (2024, December). Unlocking Rail Safety Through Technology: A Simple, High-Impact opportunity for FRA Action on Pending Waivers to Advance Safety. Alliance for Innovation and Infrastructure. https://www.aii.org/wp-content/uploads/2024/12/Unlocking-Rail-Safety-Through-Technology-Brief.pdf.
[iv] Dierker, B. & Rogers, O. (2025, April). Driving Regulatory Innovation for Safer Railroading: How
Modernizing the Waiver Process at the Federal Railroad Administration Can Revolutionize Railroad
Safety, Efficiency, and Resilience and Future-Proof the Regulatory Culture Across the Entire Federal
Government. Alliance for Innovation and Infrastructure. https://www.aii.org/wp-content/uploads/2025/04/Driving-Regulatory-Innovation-for-Safer-Railroading.pdf.
[v] Visual Track Inspections, 49 C.F.R. 213.233 (2026). https://www.ecfr.gov/current/title-49/subtitle-B/chapter-II/part-213/subpart-F/section-213.233.
[vi] Palese, M. E. (2021). Ballast particle behavior under varying conditions using tri-axial inertial sensors [master’s thesis, University of Delaware]. UDSpace. https://udspace.udel.edu/handle/19716/29020.
[vii] Federal Railroad Administration. (2024). Track geometry measurement system (TGMS) inspections (Notice of proposed rulemaking, Docket No. FRA-2024-0032, RIN 2130-AC96). U.S. Department of Transportation. https://www.federalregister.gov/d/2024-24153.
[viii] Federal Railroad Administration. (2025, May 8). Notice of Petition for Waiver of Compliance (Association of American Railroads petition re: track inspection regulations), Docket No. FRA-2025-0059. https://www.federalregister.gov/documents/2025/05/09/2025-08199/notice-of-petition-for-waiver-of-compliance.
[ix] Supra note 4.
[x] BNSF Railway Co. v. Federal Railroad Administration, No. 22-60217 (5th Cir. 2023).
https://www.ca5.uscourts.gov/opinions/pub/22/22-60217-CV0.pdf.
[xi] BNSF Railway Co. v. Federal Railroad Administration, No. 22-60217 (5th Cir. 2024). https://www.govinfo.gov/content/pkg/USCOURTS-ca5-22-60217/pdf/USCOURTS-ca5-22-60217-1.pdf.
[xii] Federal Railroad Administration. (2024). Track geometry measurement system (TGMS) inspections. Federal Register, 89(206), 84845–84861. https://www.govinfo.gov/content/pkg/FR-2024-10-24/pdf/FR-2024-10-24.pdf.
[xiii] Federal Railroad Administration. (2025, December 5). Decision letter regarding Docket No. FRA-2025-0059 [Waiver of compliance]. U.S. Department of Transportation. https://www.regulations.gov/document/FRA-2025-0059-0045.
[xiv] Union Pacific. (2026, September 8). What data shows about modern track inspections and rail safety. https://www.up.com/news/safety/what-data-shows-about-modern-track-inspections-and-rail-safety.
[xv] U.S. House of Representatives, Committee on Transportation and Infrastructure. (2025, June 24). America builds: The role of innovation and technology in a safe and efficient rail system [Hearing]. https://transportation.house.gov/calendar/eventsingle.aspx?EventID=408789.
[xvi] Track Safety Standards, 49 C.F.R. pt. 213 (2026). https://www.ecfr.gov/current/title-49/subtitle-B/chapter-II/part-213.
[xvii] Ballast, 49 C.F.R. § 213.103 (2026). https://www.ecfr.gov/current/title-49/subtitle-B/chapter-II/part-213.
[xviii] Aii analysis of Federal Railroad Administration Rail Equipment Accident/Incident Data (Form 54), 2000–2025, data accessed August 2026. https://data.transportation.gov/Railroads/Rail-Equipment-Accident-Incident-Data-Form-54-/85tf-25kj/about_data. Unique incidents were isolated by incident key and a review was conducted to remove redundant reports of the same incident by multiple parties. The analysis was conducted on reported primary causes, not all contributing conditions. This analysis does not estimate the causal effect of either visual inspection or automated inspection on derailment rates; it examines the relative prevalence and trends of accident causes each method is designed to address.
[xix] See Appendix for a more detailed breakdown of how 49 CFR Part 213 assigns inspection requirements.
[xx] Brotherhood of Maintenance of Way Employes Divisions. (n.d.). Track inspection. https://www.bmwe.org/trackinspection.
[xxi] Supra note 18.
[xxii] Federal Railroad Administration. (n.d.). Appendix X – Track, Roadbed, and Structure (Numeric). https://safetydata.fra.dot.gov/PublicObjects/Train%20Accident%20Cause/Appendix%20C%20-%20Track%20Roadbed%20and%20Structure%20-%20Numeric.pdf.
[xxiii] Data were normalized using Total Train Miles collected from FRA Operational Data (1.02).
Federal Railroad Administration. (2026). Operational Data (1.02). https://data.transportation.gov/stories/s/Operational-Data-1-02-/b39d-rg8e/.
[xxiv] Derailment rate = reported derailments ÷ total train miles × 1,000,000.
[xxv] Signal and Communication derailments actually increased from six in 1975 to fifteen in 2025. However, this represents a miniscule percentage of all derailments and is not necessarily indicative of changes in safety. Today a larger share of rail traffic moves on signaled territory – that has increased the exposure to signal-caused accidents.
[xxvi] Other Way and Structure derailments actually increased from four in 2000 to six in 2025. However, this represents a miniscule percentage of all derailments and is not necessarily indicative of changes in safety.
[xxvii] Federal Railroad Administration. (2018, March 9). Autonomous Track Geometry Measurement Technology: Design, Development, and Testing. https://railroads.fra.dot.gov/elibrary/autonomous-track-geometry-measurement-technology-design-development-and-testing.
[xxviii] Bureau of Transportation Statistics. (2024). Class I railroad system mileage and ton-miles of freight: 1960–2022. U.S. Department of Transportation. https://www.bts.gov/browse-statistical-products-and-data/info-gallery/class-i-railroad-system-mileage-and-ton-miles-0.
[xxix] These Class I operating statistics provide broader context rather than a direct exposure adjustment for the full Form 54 derailment dataset.
[xxx] This provision represents a physical piece of track equipment called a “derail” rather than a derailment incident.