Executive Summary
This paper finds that both requested and authorized electric utility Returns on Equity (ROEs) have trended downward rather than upward in the past two decades. Even with growing power demand and energy consumption over time, ROE does not appear to be a source of upward pressure on utility bills.
Utility ratemaking is the framework through which regulators balance affordability, reliability, and long-term investment in an industry built on essential, capital-intensive, and long-lived infrastructure. This is a structured process designed to balance customer protection, financial integrity, and the need to sustain reliable electric service over time. That balance is becoming more important as electricity demand rises, and the grid faces new pressure from data centers, electrification, rising interest rates, supply-chain constraints, and more.
Current debates over return on equity, cost allocation, and utility earnings cannot be reduced to slogans about profits or overcharging. ROE caps, short-term bill-suppression, and broad claims about utility profits can become harmful when they ignore how infrastructure is financed, how costs are allocated, and how decisions made now affect long-term customer outcomes.
ROE is best understood as one component of the broader ratemaking structure.
- Utilities finance infrastructure through a mix of debt and equity.
- Regulators must set returns low enough to protect consumers but high enough to allow access to capital on reasonable terms.
- In a capital-intensive sector, weakened credit metrics and increased financing costs can affect the development pace, cost, and reliability of grid investment.
- Customer protection depends on more than the authorized return.
- Regulators use cost allocation, prudence review, and performance oversight to ensure investments deliver customer value and that costs are recovered fairly.
- Oversight matters more than ever as data centers and large-load customers expand.
- National and macroeconomic trends may set the stage for grid investment, but rate cases are decided through local system needs and judgment.
- Ratemaking works best when it protects customers while keeping utilities able to finance reliable grid service and pursue needed upgrades.
- This paper explains the core mechanics of utility ratemaking and argues that the current ratemaking framework remains the most durable structure for aligning customer protection with conditions necessary to sustain electric service over time.
- It evaluates proposals to constrain returns or alter regulatory structures, while advancing a four-question framework for prudent policy reform.
- It shows why reform should strengthen prudence, transparency, and customer protection without undermining capital attraction, regulatory stability, or long-term infrastructure development.
_______________________________________________________________________________
Introduction
The modern electric grid in the United States is an engineering marvel, spanning millions of miles and continually evolving to meet the ever-increasing energy demand. Between 1975 and 2000, electricity consumption in the United States increased by 105 percent, more than doubling in just a quarter-century.[i] Then, things changed. The nation became more efficient, and electricity demand only rose slightly, even as GDP skyrocketed.
Between 2000 and 2024, electricity demand increased just 14 percent. The pace of expansion of new power generation slowed, and new transmission infrastructure projects stagnated. For the past two decades, the urgency of grid development was diminished, and utilities instead focused on upgrades, maintenance, and replacement rather than expansion.[ii]
 Figure 1: U.S. Electricity Consumption, 1950 – 2024.[iii]
Now, that period is ending. A combination of electrification, industrial expansion, data center growth, and evolving reliability demands is placing the electric system under renewed pressure once again. There is a national appetite for new grid infrastructure. The question of how this increased demand will manifest on monthly bills is fresh on the minds of many Americans.
A recent analysis found that household electricity expenditures remain near an all-time low as a share of personal expenditures, even as retail electricity prices and regional rate trends have varied in recent years.[iv] Amid a substantially changing generation mix and uneven regional demand growth, this stability is significant. Despite this, there has been rising political debate and policy discussion, most notably with an unprecedented rise in data center demand and with grid resilience concerns across the country due to weather events, capacity constraints, and evolving load growth. The electric system ultimately underpins every sector of the economy, and misguided policy proposals that weaken infrastructure growth or discourage energy investment will not be confined to the power sector. Actions taken today will have a profound effect on the economy, national security, and American life for the rest of the 21st century.
While politicians may shift priorities over time, utility policymakers and regulators do not operate under a single national mandate. Decisions are shaped by state statutes, voter initiatives, development goals, affordability pressures, environmental requirements, and reliability obligations. Ensuring needed infrastructure gets built requires a stable framework that is durable in the face of political winds and demand scenarios.
Ratemaking should be judged not by whether it lowers returns or bills in the short term, but by whether it preserves the financial, regulatory, and operational conditions needed to provide reliable electric service at reasonable long-term cost.
The Foundations of Utility Ratemaking
Electricity is not an ordinary product. In most states, customers cannot simply choose another local wires provider, and modern homes, hospitals, businesses, schools, and government institutions cannot tolerate prolonged failures in service. Utility regulation and ratemaking exist because electricity is both essential and delivered through capital-intensive infrastructure.
As electricity became central to American homes, businesses, factories, and institutions in the early 20th century, communities needed a structure capable of financing large generation, transmission, and distribution networks while protecting customers from abuse. In much of the country, this manifested as private utility investment subject to public regulation. The model has evolved over time, but the premise remains consistent: utilities must be able to attract capital on reasonable terms and customers must be protected from unreasonable rates. Today, three out of four Americans are served by investor-owned utilities.[v]
Regulated utilities have deep roots in utility law, and their place in public policy can be traced to several consequential court cases. In Bluefield Water Works v. Public Service Commission, the U.S. Supreme Court found that a public utility is entitled to an opportunity to earn a return comparable to returns on investments in other enterprises facing “corresponding risks and uncertainties.”[vi] A regulated utility is not entitled to unusually high gains, but neither can regulators assume that investment capital will remain available if allowed returns differ from comparable-risk investment opportunities.
This logic was reinforced in FPC v. Hope Natural Gas Co.[vii] There, the U.S. Supreme Court held that the “just and reasonable” standard applies to the end result of ratemaking rather than to any single formula. The court also stated that a rate that allows a utility company to “operate successfully, to maintain its financial integrity, to attract capital, and to compensate its investors for the risks assumed” is allowed and should not be condemned.
Together, Bluefield and Hope establish the legal foundation for modern ROE regulation: rate of return must be grounded in risk to support sufficient access to capital at the most reasonable rates for consumers.[viii] In practice, regulators use financial models and capital-market evidence to estimate ROE. This can be determined by examining market returns for other companies with similar levels of risk.[ix] That process is designed to translate the broad legal standards established by the courts into a specific authorized number that regulators can apply in an actual rate order.
The arrangement between utilities and the public is often described as a regulatory compact. Regulators usually confer an obligation to serve in an exclusive service territory to utilities, an avenue for cost recovery, and reasonable rate of return on invested capital. In other words, ratemaking is a balancing act that should be carefully planned and executed by policymakers and regulators to protect the public and incentivize growth, affordability, and investment. Regulators must understand both the investment and consumer side of every decision. When this process is misunderstood or misrepresented, public discussion can drift toward simplified narratives detrimental to productivity and growth.
How ROE is Determined and Why It Matters
ROE sits at the intersection of economics, law, and public policy. Authorized ROE is set through formal proceedings before Public Utility Commissions (PUCs) that review financial evidence, hear expert testimony, weigh competing views about market conditions, utility risk, and investor expectations, and survey various financial models for market returns.[x] Setting ROE levels is quasi-judicial in nature.[xi]

Figure 2: ROE Distinctions
Utilities typically finance their assets through a combination of debt and equity. Debt is money a utility borrows and must repay with interest. Equity is the money investors put into the utility, but those investors take on more risk because their return is not fixed and depends on a utility’s financial performance and environment. The “cost of equity” refers to the return investors require to provide equity capital to the utility, while authorized ROE is the regulatory estimate of that cost and the return shareholders are permitted the opportunity to earn through rates. Regulators aim to set the ROE low enough to protect consumers but high enough to keep the utility financially healthy. A financially healthy utility allows it to access capital markets on reasonable terms and attracts the debt and equity investment needed to fund long-lived infrastructure.
Most authorized ROEs for utilities in the U.S. currently hover roughly around 9.0 percent to 11 percent.[xii] In new rate cases since 2020, the average authorized ROE is 9.69 percent.[xiii] However, these figures do not always represent what utilities actually earn. Authorized ROE is the return regulators allow a utility the opportunity to earn; earned ROE reflects actual financial performance after operating costs, inflation, fluctuating interest rates, project timing, demand shifts, and rate case outcomes.
In recent years, earned ROEs in the electric utility sector have fallen farther below authorized ROEs.[xiv] Authorized ROE can lag behind market conditions because regulatory frameworks are designed to provide stable returns over time. Relatively low authorized ROEs compared with the actual cost of capital can directly affect utility credit metrics.[xv]

Figure 3: Average U.S. Electric Utility ROE[xvi]
Although ROE levels can vary on a case-by-case basis, both requested and authorized ROE levels have declined markedly since the turn of the century. This long-term trend directly addresses broad concerns that authorized utility ROEs have moved systematically upward.
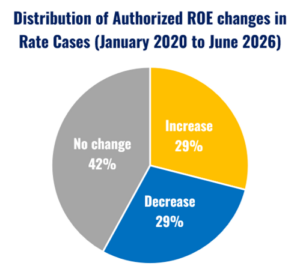
Recent data also demonstrate that new rate cases are not leading to higher ROEs. In 69 electric utility rate cases since 2020 with data for current and previous return on equity, ROE increased in only 20 of them (29 percent).[xvii] Authorized ROE was just as likely to decrease and remained the same 42 percent of the time. Even where authorized ROE changed, the movement was generally modest: changes greater than 0.5 percentage points occurred in only six cases split between three increases and three decreases.
In rate cases since 2020 where both requested and authorized ROE were available, authorized ROE was below the requested level in 92 of 105 cases, with an average difference of 0.61 percentage points from 10.26 percent requested to 9.69 percent authorized.[xviii] This gap should not be understood as evidence that requested ROEs are categorically excessive or that reductions are inherently warranted. Rather, it reflects the ordinary structure of rate proceedings: utilities present evidence on the return they believe is necessary to attract capital and maintain financial integrity, while regulators weigh that evidence against consumer protection, market conditions, utility risk, capital structure, and the full record in each case.
Importantly, ROE only applies to the portion of a utility funded by equity and does not apply to the entire rate base. In a rate case, regulators calculate a utility’s revenue requirement, which is the total amount the utility is allowed to collect from customers to recover prudent costs and provide an authorized return on invested capital.[xix] For example, if regulators approve a capital structure consisting of 52 percent equity and 48 percent debt, and authorize a 10 percent ROE, the equity portion contributes 5.2 percentage points to the utility’s authorized overall rate of return.
The debt portion is treated separately and recovered at its own authorized cost of debt.[xx] If the authorized cost of debt were five percent, the debt portion would contribute another 2.4 percentage points, producing an authorized overall rate of return of 7.6 percent. This authorized overall rate of return, not the ROE alone, is applied to the rate base to calculate the return component of the revenue requirement.
| Component | Share of Capital Structure | Authorized rate | Weighted Contribution to Authorized Overall Rate of Return |
| Equity | 52% | 10.0% (ROE) | 5.2% |
| Debt | 48% | 5% (debt interest) | 2.4% |
| Authorized overall rate of return | 100% | 7.6% |
Table 1: Illustrative Overall Rate of Return
In new rate cases since 2020, electric utilities averaged 50.52 percent equity, with an authorized ROE of 9.69 percent and a cost of debt of 4.49 percent.[xxi] Using the approved capital structures in those cases, the resulting authorized overall rate of return averaged 7.12 percent. The equity component contributed roughly 4.95 percentage points, while the debt component contributed roughly 2.19 percentage points. ROE is important, but it is only one part of the capital structure used to calculate the authorized return included in the revenue requirement.
Return on equity is a salient part of utility ratemaking, but it is a metric also used in many other sectors. As a matter of scale, even a utility ROE of 10 percent is lower than the average ROE observed in many familiar economic sectors. For context of scale only, not regulatory structure, recent U.S. sector data show roughly 12.9 percent for grocery and food retail, 19.1 percent for insurance, 26.1 percent for general retail, and 34.4 percent for automotive retail, versus 10.4 percent for general utilities.[xxii] The non-regulated power producer sector has an ROE of 12.4 percent.[xxiii]
Where the Debate Often Goes Wrong
Public debate over ratemaking often becomes confusing because it blends together concepts and variables of ratemaking that are each distinct. Authorized ROE is not the same as stock price, market capitalization, or observed earnings in a given year. The cost of capital reflects the cost of the debt and equity used to finance utility investments. ROE represents the estimated cost of the equity portion of that financing. The Federal Energy Regulatory Commission’s (FERC) ROE orders treat the issue as one of estimating a just and reasonable return through financial models and comparable-risk analysis.
There is a clear distinction between requested ROE, authorized ROE, and earned ROE.
| ROE term | Meaning |
| Requested ROE | The return a utility argues is necessary to attract investors, maintain financial integrity, and fund new or upgraded infrastructure. |
| Authorized ROE | The return regulators determine is just and reasonable to protect customers and keep a utility financially healthy. |
| Earned ROE | The return a utility actually realizes after operating costs, interest rate changes, demand shifts, project timing, and performance outcomes. |
Table 2: ROE Distinctions Defined
Each of these ROE figures is distinct, but each plays an important role in the ratemaking process. Earned ROE may be higher or lower than the authorized level, which is why authorized ROE should be understood as an opportunity to earn a regulated return, not a guaranteed profit.[xxiv]
Public understanding matters because rate cases do not happen in a vacuum. The revenue requirement – of which ROE is just one element – reflects significant experience and planning in engineering, finance, economics, reliability, depreciation, load forecasts, and cost allocation.
Most Americans encounter the electric system only through a monthly bill, so when these bills go up, they may not understand the factors behind it. Even prudent or critical investments can come under scrutiny when only focusing on one aspect of ratemaking, instead of the full picture.
One common misunderstanding is the assumption that strong stock performance proves that regulators have set ROE too high. Stock prices reflect expectations about future earnings, interest rates, broad market sentiment, regulatory developments, and judgments about future risk. FERC’s 2020 ROE methodology relies on model-based approaches such as discounted cash flow and the capital asset pricing model, rather than on stock-price movements.[xxv] Market valuation can inform regulatory analysis, but it is not itself the ratemaking mechanism. Additionally, once ROE is set for a utility, it may stay in place for years.[xxvi] Average authorized ROE levels across the nation are significantly lower than they were two decades ago.
The National Association of Regulatory Utility Commissioners’ (NARUC) ratemaking guide defines the allowed return in the revenue requirement formula as an “authorized (not guaranteed) rate of return,” and a CPUC release states that utilities earn the full authorized ROE only when they effectively manage costs, maintain safe operations, and deliver projects on time and on budget.[xxvii],[xxviii] State regulators have reduced ROE and imposed fines for utilities in the past for violations and poor performance.[xxix]
High-level criticisms can also miss the financing realities of the electric system. Utilities operate in a capital-intensive environment built around long-lived assets whose costs are incurred up front and recovered over many years. Capital investment costs now comprise the majority of spending on utility infrastructure, and the EIA reports that capital investment in distribution infrastructure increased by $31.4 billion from 2003 to 2023, a 160 percent increase.[xxx] A significant portion of utility financial capacity is tied back to serving customers through ongoing infrastructure investment, maintenance, and system modernization. Energy bills may feel like a problem of the present, but they are influenced by years of investment and long-term capital recovery, both in the past and in the future.
Utilities operate within an environment shaped by political pressures, public expectations, and the judgment of individual commissions and policymakers. Focusing too narrowly on ROE can obscure the larger picture. Strategic utility planning depends not only on financial models, but also on consumer confidence, regulatory legitimacy, and public mandates.
The Consequences of Politicizing Ratemaking and ROE
After years of relatively stable demand, new factors are creating a need for new generation, transmission, and distribution investment. AI, data centers, advanced manufacturing, and electrification are all converging. The U.S. Department of Energy (DOE) estimates that data center energy use could reach as high as 580 TWh by 2028, constituting 12 percent of total U.S. electricity consumption, and more than double current demand.[xxxi]
Public officials have the obligation to ask if rates are justified, how transparent the ratemaking mechanism is, and whether proposed investments are tied to actual improvements in customer value and reliability. The problem arises when political pressure to lower electric bills ultimately undermines essential long-term grid investment.
The nature of the existing regulatory framework is designed to prevent imprudent spending and price gouging, but many consumers see electricity bills rise and assume the worst. Reactions to price increases can produce political pressure that unintentionally weakens the system over time. Recent proposals in Pennsylvania illustrate how affordability rhetoric can move from legitimate scrutiny into proposed overhauls that reshape the capital framework itself.
In May 2026, the Governor of Pennsylvania sent a letter to utility leaders calling for investment reforms and labeled the current system “broken.”[xxxii] The Pennsylvania General Assembly introduced a bill immediately after this letter that would limit investor-owned utilities’ ROE to the 10-year Treasury yield plus two percent, implying returns of roughly 6.5 to 7 percent.[xxxiii] Supporters argue that the proposal limits excessive utility profits and aligns authorized returns with the actual cost of equity. Critics countered that a statutory cap threatens infrastructure investment, squeezes capital availability, and may raise costs in the long term.
The financial gap between a Treasury-based cap and recent authorized ROE levels illustrates why a simple formula may not reflect the risk profile of equity capital.
| Metric | Approximate value | What it represents |
| 10-year Treasury yield[xxxiv] | ~4.5% | Risk-free benchmark |
| Pennsylvania proposed cap: Treasury + 2% |
~6.5% | Proposed statutory ROE cap |
| Average cost of debt (2020-2026) [xxxv] | ~4.49% | Recent regulatory benchmark |
| Average authorized electric utility ROE (2020-2026)[xxxvi] | ~9.69% | Recent regulatory benchmark |
Table 3: Metric Comparisons
A Treasury-plus-two-percent formula would place the allowed ROE much closer to debt markets than to recent authorized electric utility ROEs or the cost of equity. That matters because common equity is risk-bearing capital, not a fixed-income instrument, and investors require compensation for risks that Treasury yields do not reflect.
Many regulators and industry observers argue that the move threatens to destabilize the regulatory environment at a time when new investment is critical.[xxxvii] The Governor’s comments that utilities should finance projects with more debt rather than investor capital also received pushback. The plan could trigger credit-rating downgrades and would rely on access to debt markets. Because debt costs are generally recovered through rates, higher financing costs can place pressure on customer bills over time.[xxxviii] Such a move could also discourage, delay, or increase the cost of needed grid investment in Pennsylvania. The Pennsylvania Public Utilities Commission also pushed back against the letter and reasserted its transparency and fairness to consumers.[xxxix]
While political proposals and potential reforms can illustrate what may occur, a glimpse of real-world impact has already been demonstrated. One opportunity to evaluate the consequences of overhauling the current system can be seen in the state of Connecticut, which in 2020 enacted ratemaking that “weakened utility cash flow,” according to John D. Quackenbush, CFA, and increased regulatory requirements for ROE.[xl],[xli] That example matters here because it shows how return-related reforms can move quickly from consumer-protection rhetoric into weaker cash flow, tighter credit conditions, and reduced flexibility to finance needed system investment.
When credit metrics weaken, utilities may face higher financing costs or reduced flexibility, both of which can affect the pace and cost of needed infrastructure investment. Morningstar DBRS found that average cash flow to adjusted debt among a sample of North American gas and electric utilities it rates declined from 16.6 percent in 2019 to 14.6 percent in 2023, with weakening credit metrics driven largely by regulatory lag, significant capital needs, and macroeconomic pressures.[xlii]
Even modest changes in financing costs can matter for customers because utility infrastructure is expensive and long-lived.[xliii] If a utility must finance a $500 million distribution upgrade, and half of the project is debt-financed, even a one percentage-point increase in borrowing costs on the debt portion would add roughly $2.5 million in annual financing costs before considering taxes, depreciation, or other ratemaking adjustments, and would likely flow into customer rates through the revenue requirement over time.
Large-scale changes to the regulatory framework like the one proposed in Pennsylvania would arrive at a moment of unusually high infrastructure interest and investment need. Data center growth is increasingly visible in national electricity consumption data, with U.S. commercial-sector electricity use increasing by over 200 billion kWh between 2020 and 2025, the largest five-year increase on record.[xliv]
 Figure 5: U.S. Energy Consumption by Sector, 1950 – 2025[xlv]
This trend of increased electricity consumption will impact Pennsylvania as well. A presentation from the Pennsylvania PUC projected 5 GW of increased data center usage in PPL[xlvi] territory by 2030, while noting that Pennsylvania’s current peak load is just under 30 GW.[xlvii] Data center facilities usually connect at much higher voltages than ordinary distribution facilities and may require new dedicated 138 kV connections and other grid upgrades.
In this evolving electric environment, regulatory stability matters because capital-intensive projects require long planning horizons, cost recovery mechanisms, and confidence that rate decisions will be based on evidence rather than political formulas. The risk of politicizing ROE is not only that utilities will earn less from rate cases, but that the ratemaking process itself becomes less predictable and more chaotic at the very moment when state commissions and policymakers are evaluating larger, more complex infrastructure needs for the entire economy.
Cost Allocation
If ROE determines the return necessary to attract capital, cost allocation determines who should pay for the costs of serving the system. Cost allocation is the point in ratemaking where a utility’s overall revenue requirement is divided among different classes of customers and is guided by two central principles: cost causation and cost-follow-benefits.[xlviii]
Cost causation means costs should be assigned to the customers or classes that cause them.
Costs-follow-benefits means costs should be assigned to the customers that benefit from the service provided.
Residential, commercial, and industrial customers have very different usage patterns, peak demands, voltage requirements, and service expectations. These differences are visible even within a single day: commercial loads tend to rise during business hours while residential demand often peaks late in the day.[xlix]
Data centers are an important and very different type of customer compared to a residential household, and with projected growth may consume thousands of times more electricity. Cost allocation is therefore a tool to protect everyday customers by ensuring they are not asked to subsidize costs caused by customers with very different demands on the system.
Demand-related costs have historically been allocated using measures such as coincident peak demand (system peak), class peak demand, and non-coincident peak demand (total sum of maximum demands of customers).[l] The timing of demand is as important as the overall amount of power consumed. A customer class that contributes heavily to system peaks may drive the need for new capacity upgrades in ways that another class does not. A one-size-fits-all approach to cost allocation undermines fairness in the system by obscuring differences in responsibility.
Large-load tariffs are one solution regulators are implementing to preserve that fairness, as data centers and other major customers connect to the grid. Properly designed tariffs can require large users like data centers to make longer-term commitments, pay minimum demand charges, provide financial security, and cover the direct infrastructure costs needed to serve them. These provisions are tools to keep other customers from paying for infrastructure built for large-scale energy users that may not fully materialize or leave early.[li] Pennsylvania has already moved in this direction. In 2026, the Pennsylvania PUC advanced a model large-load tariff framework for high-demand customers like data centers.[lii] The framework is intended to guide large-load growth, while protecting ratepayers from unfair cost impacts.
Cost allocation remains one of the most debated and scrutinized sections of ratemaking. At its heart, all pricing methods and cost allocations are administrative simplifications.[liii] Stakeholders may be able to agree on the cost of electricity and even the need for further infrastructure, but they often disagree over who should pay for it.
Customer, State, and System Impacts
Ratemaking is technical because the electric system is not uniform. Rate cases bring together engineering plans, complex depreciation schedules, fuel costs, load forecasts, customer usage patterns, testimony from utility and consumer advocates, and much more. It is a labor-intensive process with dozens of stakeholders. The system can be slow and complex, but that complexity reflects the countless interests and technical inputs that must be balanced before rates are approved. It is the mechanism that translates all of the variables into the prices customers ultimately pay.
The vast majority of ratemaking and electric distribution decisions happen on the state or local level. Disputes are filtered through state-specific commissions, statutory requirements, and local system needs. A ratemaking change that seems advantageous to one state or utility might not have the same effect in a different state or different utility, especially where system age, climate, fuel mix, growth pressures, or investment requirements differ substantially.
Data on rate cases since 2020 reinforces this variation. Authorized ROEs in the dataset ranged from 7.36 percent to 11.45 percent, equity ratios range from 43 percent to just over 60 percent, and authorized overall rates of return range from 3.61 percent to 9.36 percent.[liv] State commissions are not applying a single national formula, but are making case-specific decisions based on utility risk, capital structure, financing costs, past performance, and local regulatory judgment.
 Figure 6: U.S. Average Electricity Price per Kilowatt-Hour in U.S. City, 2025 Dollars[lv],[lvi]
According to the Lawrence Berkeley National Laboratory 2026 retail price update, national residential electricity spending constituted 1.25 percent of personal expenditures in 2025, near an all-time low.[lvii] At the same time, regional prices vary considerably, and recent price changes have not been uniform across the country. General allegations of national electricity price increases conceal the great differences between states, with outcomes shaped by local regulatory decisions and conditions.[lviii]
A wide range of drivers such as fuel prices, capital expenditures, load increase, utility funding and regulatory lag influence the retail electricity prices. Energy bills are not merely a calculation of how much electricity is consumed, but include the costs of generation, transmission, and delivery of electricity, not to mention taxes, fees and, of course, return on equity.[lix]
These differences are becoming more important as reliability pressures rise and existing infrastructure continues to age. NERC’s long term reliability assessment carries warnings that resource adequacy risks are rising across North America, and that five power grids serving over a hundred million people have a risk level of “high” by 2030.[lx] Utilities are also hampered by supply chain issues for advanced equipment and materials.[lxi] Wait times for gas-fired turbines have reportedly been stretched to as long as seven years.[lxii] Summer peak demand is forecast to grow by 224 GW over the next decade, with new data centers and large loads accounting for most of the projected increase.[lxiii] A lack of transformers, switchgear, and batteries has already delayed over half of new data center projects in 2026.[lxiv]
These conditions make the effective management of utility grids and ratemaking essential for long-term system readiness. The same regulatory structure must account for different local systems, customer classes, policy requirements, and infrastructure needs. Broad national claims about electricity prices or utility returns can miss the practical realities facing individual states and commissions.
Affordability, Reliability, and Long-Term Investment
Utility health and consumer prosperity are often interdependent, and the same set of factors allows them to be achieved in tandem. Affordability, reliability, and long-term investment, while often discussed as separate policy goals, are closely linked. Effective investment in future infrastructure is crucial for energy costs to remain low and consistent.
The Edison Electric Institute (EEI) reported that investor-owned electric companies spent $32.6 billion on transmission development and $60.2 billion on distribution investment in 2024, with a further $178 billion in transmission construction planned for 2025 to 2028.[lxv] Those figures show why capital attraction is not an abstract shareholder issue, but a practical condition for building and maintaining the infrastructure customers depend on.
Decisions that suppress customer bills in the short term can increase long-term costs if they delay needed infrastructure. Timely investment can improve reliability, reduce congestion, and expand access to lower-cost resources. In explaining a recent rule on cost allocation and transmission planning, FERC says the rule is “intended to ensure continued electric service in the face of growing reliability challenges and greater access to lower-cost generation supplied by a wide range of resources.”[lxvi] Utility capital expenditure programs have reached unprecedented levels, with many utilities rolling out capex programs 10 percent to 20 percent greater than prior cycles for climate adaptation, modernization, and energy transition investments due to significant increases in demand.[lxvii]
Long-term regional transmission planning requires using a 20-year horizon and cost-benefit analysis to identify cost-effective solutions. These timelines are becoming increasingly difficult in an innovative, interconnected, and disruptive world. National priorities may not always align with voter-approved mandates from individual states, and specific projects may be disrupted by litigation or deployment concerns. Even so, proper planning and execution are crucial to economic growth and lower costs. The DOE estimated that access to low-cost generation and enhanced transmission deployment could save electricity consumers $320 billion in present-value costs through 2050, relative to a future with restricted transmission growth.[lxviii]
DOE’s report on the future of resource adequacy emphasizes that planners should compare systems, not only in terms of reliability, but also for affordability, security, resilience, and sustainability, and that no single resource is perfectly reliable.[lxix] When debate is reduced to a single metric or a single expansion project, it becomes easier to overlook the long-term consequences of every utility decision.
Reform Proposals Should Strengthen Existing Ratemaking
There is no single popular reform agenda for ROE and ratemaking, but most proposals fall into a few categories:
- efforts to reduce allowed returns,
- efforts to modify ratemaking structures and incentives, or
- efforts to increase scrutiny of utility spending and cost allocation.
Each type of reform should be evaluated by whether it solves a demonstrated problem without weakening the conditions needed for reliable service, fair cost assignment, and long-term infrastructure investment. Any serious reform debate must recognize that there is no single electric system in the United States. Regional market structures vary significantly, and even traditionally-regulated utility systems can differ in important ways. Current systems, though diverse, already attempt to balance customer outcomes, preserve confidence in the process, support necessary investment, and reflect actual financing conditions.
Recent examples show both the appeal and risk of reform. In New York, lawmakers introduced legislation that would cap public gas and electric utilities at a four percent annual return on equity, replacing case-specific regulatory judgment with a fixed statutory ceiling.[lxx] In some circumstances, a lower return may reflect legitimate efforts to protect customers, but often these proposed changes are a response to political pressure rather than the deeper drivers of infrastructure cost. ROE caps do nothing to solve the political economy of infrastructure approval, and do not diminish the urgent need for new buildouts. Limiting ROE may decrease the level of investment in energy infrastructure, ultimately costing the customers themselves in the long term.
None of this means utility requests should be accepted at face value. Prudence review, cost allocation, performance oversight, and customer protection remain essential. The question is whether proposed reforms improve that discipline or simply add blunt constraints that weaken investment and regulatory stability.
Many criticisms of utility regulation are not really about ROE, but about whether particular costs, projects, or allocations are prudent and fair. Strong prudence review can protect customers from waste, but if taken too far, these reforms can also undermine regulatory stability and long-term infrastructure development.
As policymakers, advocates, utilities, and consumers continue the dialogue, four questions provide a useful framework for evaluating reform debates. For each proposed reform:
- Does it address a real and demonstrated cost problem?
- Does it preserve the commission or utility’s ability to finance necessary infrastructure?
- Does it assign costs to the customer classes that cause or benefit from them?
- Does it improve regulatory discipline without adding political volatility or regulatory uncertainty?
Conclusion
Electric utility ratemaking is easy to criticize in small bites: A single failing infrastructure project, a single rate case, a single profit return that seems too high, a single elevated monthly energy bill. All of these things can look unreasonable in isolation, but each is part of an imperfect larger system – a compromise. Nonetheless, electric service accounts for a smaller share of household spending than almost ever before, and critical disruptions are rare.
Most Americans spare little thought for where and how their electricity arrives in their homes. They simply trust that when they flip the switch, light will come on. The ratemaking process exists because as a society, people have decided electric service should be reliable, broadly available, and paid for, in part, by everyone who uses it. Making the system work requires astute judgment, risk management, cost allocation, and effective planning for long-term needs.
Debate over ratemaking is ultimately a good thing. For every poorly thought-out reform proposal, there are stakeholders and advocates attempting to refine the existing process and prepare it for the changes the future will bring, whether at a national or local level. Evaluating reform proposals should not be as black-and-white as “pro-utility” or “pro-consumer.”
With both requested and authorized return on equity trending downward over the last two decades, the evidence complicates broad political narratives and good-faith concerns about utility profiteering. Requested ROE is a technical, context-specific proposal advanced through evidence in a rate proceeding, not simply an opening bargaining position. When regulators authorize a different level – often, but not always, below the requested figure – that outcome should be understood as part of case-specific regulatory judgment rather than as evidence that ROE reductions are inherently warranted.
Ratemaking and electric utility regulations are truly a balancing act. Only a disciplined, economically-grounded approach to affordability and reliability will be able to keep up with the ever-innovating world. In the end, utility ratemaking should be evaluated through facts, incentives, constraints, and long-term outcomes rather than oversimplified narratives to choose political expedience over prudence. Rather than replace evidence-based review with blunt constraints that weaken the system’s ability to finance long-term needs, all reforms should strengthen the discipline of ratemaking. The current system remains the strongest foundation for doing this today.
Methodological Note
Aii compiled its ROE dataset through docket-level review using the Halcyon platform, drawing from individual investor-owned electric utility rate cases and recording available figures for requested ROE, authorized ROE, prior authorized ROE, capital structure, cost of debt, and related rate-of-return components. These values were then reviewed, organized, and averaged to identify directional trends over time and to compare requested returns with authorized outcomes. Beyond this dataset, the paper serves as a targeted literature review and synthesis of existing public data, regulatory materials, industry reporting, and policy analysis, with the goal of translating complex ratemaking issues into a practical, decision-relevant framework. The analysis is intended to provide a public-data-based view of ratemaking trends rather than a complete census of every utility proceeding or a substitute for case-specific regulatory review. Aii retains independent editorial control over all research, analysis, framing, and conclusions presented in our reports.
Citations and Notes
[i] U.S. Energy Information Administration. (2026). Electricity explained: Use of electricity. https://www.eia.gov/energyexplained/electricity/use-of-electricity.php.
[ii] U.S. Energy Information Administration. (2024, November 18). Grid Infrastructure investments drive increase in utility spending over the last two decades. Today in Energy. https://www.eia.gov/todayinenergy/detail.php?id=63724.
[iii] Supra note 1.
[iv] Wiser, R., Barbose, G., Gorman, W., O’Shaughnessy, E., Forrester, S., Donohoo-Vallett, P., Cappers, P., Deason, J., Hledik, R., & Lam, L. (2026, April). Retail electricity price trends and drivers: Data update – 2026 edition. Lawrence Berkeley National Laboratory; The Brattle Group. https://emp.lbl.gov/sites/default/files/2026-03/Retail%20Price%20Trends_2026%20edition.pdf.
[v] U.S. Energy Information Administration. (2019, August 15). Investor-owned utilities served 72% of U.S. electricity customers in 2017. Today in Energy. https://www.eia.gov/todayinenergy/detail.php?id=40913.
[vi] Bluefield Water Works and Improvement Co. v. Public Service Commission, 262 U.S. 679 (1923). https://supreme.justia.com/cases/federal/us/262/679/.
[vii] Federal Power Commission v. Hope Natural Gas Co., 320 U.S. 591 (1944). https://supreme.justia.com/cases/federal/us/320/591/.
[viii] Bittner, C. (2010, November 8). Price regulation and accounting III: Cost of capital overview. NARUC Energy Regulatory Partnership Program. https://pubs.naruc.org/pub.cfm?id=5387EA6F-2354-D714-5112-DC011E80F080.
[ix] California Public Utilities Commission. (2025, December 18). What is cost of capital (CoC)? https://www.cpuc.ca.gov/industries-and-topics/electrical-energy/electric-costs/cost-of-capital.
[x] Ibid.
[xi] Valainis, A., Antal, A., & Kadoch, C. (2025, May 30). Why Am I Here? Looking at a Commission’s Role in the IRP Process. Regulatory Assistance Project. https://www.raponline.org/blog/why-am-i-here-looking-at-a-commissions-role-in-the-irp-process/.
[xii] Lowrey, D. (2024, May 29). Underearning spread widens for gas, electric utilities in ROE analysis. S&P Global Market Intelligence. https://www.spglobal.com/market-intelligence/en/news-insights/research/underearning-spread-widens-for-gas-electric-utilities-in-roe-analysis.
[xiii] Figures are based on Aii’s independent analysis of investor-owned electric utility rate cases settled between January 2020 and June 2026.
[xiv] Supra note 12.
[xv] Morningstar DBRS. (2024, May 15). Losing steam: Weakening credit metrics in the North American utilities sector. https://dbrs.morningstar.com/research/432729/losing-steam-weakening-credit-metrics-in-the-north-american-utilities-sector.
[xvi] Data from S&P Global Market Intelligence, Regulatory Research Associates.
[xvii] Aii independent rate-case analysis.
[xviii] Ibid.
[xix] Revenue Requirement formula: RR = (RB × ra) + O&M + D + T
RR = total test year (annualized) revenue requirements from rates.
RB = rate base (original cost of invested utility plant in service net of accumulated depreciation & adjustments) – a regulatory construct.
ra = authorized (not guaranteed) rate of return to compensate debt holders and equity shareholders.
O&M = operation and maintenance expenses, including administrative and general.
D = depreciation and amortization expense.
T = taxes other than income and income tax expense.
The Revenue Requirement (RR) is the total amount of money a utility needs to collect from customers to cover its expenses and provide a return to its investors.
[xx] Quackenbush, J.D. (2019, December). Tariff Toolkit: Cost of Capital and Capital Markets. National Association of Regulatory Commissioners. https://pubs.naruc.org/pub.cfm?id=CAD801A0-155D-0A36-316A-B9E8C935EE4D.
[xxi] Aii independent rate-case analysis.
[xxii] Damodaran, A. (2026, January). Return on Equity by Sector (US). NYU Stern School of Business. https://pages.stern.nyu.edu/~adamodar/New_Home_Page/datafile/roe.html.
[xxiii] Ibid.
[xxiv] Some jurisdictions may also use earnings sharing mechanisms (ESM) or similar regulatory tools to address overearning. Under these mechanisms, if a utility earns above an authorized threshold, a portion of the excess earnings may be returned to customers or used to reduce rates in a later proceeding. Additionally, utilities that regularly over-earn are likely to have their rates reduced by regulators. Authorized ROE is not an unconditional entitlement to retain all earnings above the approved return.
[xxv] Federal Energy Regulatory Commission. (2020, May 21). Opinion No. 569-A: Order on Rehearing (Docket Nos. EL14-12-004 and EL15-45-013). https://www.ferc.gov/sites/default/files/2020-06/E-1-052120.pdf.
[xxvi] Supra note 9.
[xxvii] National Association of Regulatory Utility Commissioners. (2026). Ratemaking fundamentals and principles. https://www.naruc.org/commissioners-desk-reference-manual/3-ratemaking-fundamentals-and-principles/.
[xxviii] California Public Utilities Commission. (2025, December 18). CPUC Sets Cost of Capital for State’s Largest Energy Utilities. https://docs.cpuc.ca.gov/PublishedDocs/Published/G000/M591/K575/591575400.PDF.
[xxix] California Public Utilities Commission. (2004, July 7). Decision 04-07-033: Approving Rate Increase and Imposing Fine. https://docs.cpuc.ca.gov/published/Final_decision/38139-04.htm.
[xxx] Supra note 2.
[xxxi] Shehabi, A., Smith, S. J., Hubbard, A., Newkirk, A., Lei, N., Siddik, M. A. B., Holecek, B., Koomey, J., Masanet, E., & Sartor, D. (2024, December). 2024 United States Data Center Energy Usage Report (LBNL-2001637). Lawrence Berkeley National Laboratory, Berkeley, California. https://eta-publications.lbl.gov/sites/default/files/2024-12/lbnl-2024-united-states-data-center-energy-usage-report.pdf.
[xxxii] Phillips, S. (2026, May 3). Pa. Gov. Shapiro says regulated utility system is ‘broken’. WHYY News Climate Desk. https://whyy.org/articles/pennsylvania-governor-josh-shapiro-utilities-letter-corporate-profits/.
[xxxiii] Phillips, S. (2026, May 18). Bill would rein in Pa. utility profits: ‘The entire system is out of whack’. https://whyy.org/articles/pennsylvania-legislation-peco-utility-profits-wall-street/.
[xxxiv] Board of Governors of the Federal Reserve System. (2026, May 1). Market yield on U.S. Treasury securities at 10-year constant maturity, quoted on an investment basis [DGS10]. Federal Reserve Bank of St. Louis. https://fred.stlouisfed.org/series/DGS10/.
[xxxv] Aii independent rate-case analysis.
[xxxvi] Ibid.
[xxxvii] Riley, K. (2026, May 8). PA Gov. Shapiro’s utility rate crackdown draws pushback from industry, regulators, and Wall Street. Daily Energy Insider. https://dailyenergyinsider.com/news/52198-pa-gov-shapiros-utility-rate-crackdown-draws-pushback-from-industry-regulators-and-wall-street/.
[xxxviii] Connecticut Office of Consumer Counsel. (2024, December). OCC FAQ: Explaining the impact and drivers of S&P downgrades of Connecticut utilities’ credit ratings. https://portal.ct.gov/occ/-/media/occ/final-dec-2024-credit-rating-faq.pdf.
[xxxix] Supra note 37.
[xl] An Act Concerning Emergency Response by Electric Distribution Companies, the Regulation of Other Public Utilities and Nexus Provisions for Certain Disaster-Related or Emergency-Related Work Performed in the State. Conn. Public Act 20-5 (2020). https://www.cga.ct.gov/asp/cgabillstatus/cgabillstatus.asp?selBillType=Bill&which_year=2020&bill_num=7006
[xli] Riley, K. (2026, March 24). Utility ROE caps could backfire on customers by raising costs. Daily Energy Insider. https://dailyenergyinsider.com/featured/51598-utility-roe-caps-could-backfire-on-customers-by-raising-costs/.
[xlii] Supra note 15.
[xliii] For example, higher debt costs and weaker credit access can cause utilities to defer, resize, or sequence projects differently. While no two projects are identical, the practical impact of regulatory restriction is directionally the same.
[xliv] U.S. Energy Information Administration. (2026, May). Energy consumption estimates by sector. In Total energy annual data. https://www.eia.gov/totalenergy/data/annual/.
[xlv] Ibid.
[xlvi] Formerly Pennsylvania Power & Light utility
[xlvii] Pennsylvania Public Utility Commission. (2023). Features of data center load growth in PJM [PowerPoint Presentation]. Citizens Advisory Council, Pennsylvania Department of Environmental Protection. https://files.dep.state.pa.us/PublicParticipation/Citizens%20Advisory%20Council/CACPortalFiles/Meetings/2025_01/PUC_Presentation_Data_Centers_DEP-CAC.pdf
[xlviii] Lazar, J., Chernick, P., Marcus, W., & LeBel, M. (2020, January). Electric cost allocation for a new era: A manual. Regulatory Assistance Project. https://www.raponline.org/wp-content/uploads/2023/09/rap-lazar-chernick-marcus-lebel-electric-cost-allocation-new-era-2020-january.pdf.
[xlix] Wilson, E., Parker, A., Fontanini, A., Present, E., Reyna, J., Adhikari, R., Bianchi, C., CaraDonna, C., Dahlhausen, M., Kim, J., LeBar, A., Liu, L., Praprost, M., Zhang, L., DeWitt, P., Merket, N., Speake, A., Hong, T., Li, H., … Li, Q. (2022). End-Use Load Profiles for the U.S. Building Stock: Methodology and Results of Model Calibration, Validation, and Uncertainty Quantification. https://doi.org/10.2172/1854582.
[l] Lazar, J. (2015, August 31). Dividing the pie: Cost allocation, the first step in rate design process. In Smart rate design for a smart future (Appendix A). Regulatory Assistance Project. https://www.raponline.org/wp-content/uploads/2023/09/appendix-a-smart-rate-design-2015-aug-31.pdf.
[li] Perez, A., Wang, S., & Shwisberg, L. (2025, November 7). Large energy users want power: Here’s how to protect ratepayers from the costs. Rocky Mountain Institute. https://rmi.org/large-energy-users-want-power-heres-how-to-protect-other-ratepayers-from-the-costs
[lii] Pennsylvania Public Utility Commission. (2026, April 30). PUC acts to protect ratepayers, guide data center growth with new large load tariff framework (Docket No. M-2025-30542710). https://www.puc.pa.gov/press-release/2026/puc-acts-to-protect-ratepayers-guide-data-center-growth-with-new-large-load-tariff-framework-4-30-26.
[liii] Supra note 48.
[liv] Aii independent rate-case analysis.
[lv] U.S. Bureau of Labor Statistics. (2026, May 12). Average Price: Electricity per Kilowatt-Hour in U.S. City Average [APU000072610]. Federal Reserve Bank of St, Louis. https://fred.stlouisfed.org/series/APU000072610.
[lvi] U.S. Bureau of Labor Statistics. (2026, May 12). Consumer Price Index for All Urban Consumers: All Items in U.S. City Average [CPIAUCSL]. Federal Reserve Bank of St. Louis. https://fred.stlouisfed.org/series/CPIAUCSL.
[lvii] Supra note 4.
[lviii] Layton, R. (2026, April 13). A closer look at U.S. electricity rate trends. The Regulatory Review. https://www.theregreview.org/2026/04/13/layton-a-closer-look-at-u-s-electricity-rate-trends/.
[lix] U.S. Energy Information Administration. (2025, May 14). U.S. electricity prices continue steady increase. Today in energy. https://www.eia.gov/todayinenergy/detail.php?id=65284.
[lx] North American Electric Reliability Corporation. (2026, February). 2025 Long-Term Reliability Assessment. https://prod.nerc.com/globalassets/our-work/assessments/nerc_ltra_2025.pdf.
[lxi] Midwest Reliability Organization. (2026, February). Regional Risk Assessment. https://www.mro.net/document/mro-2026-regional-risk-assessment-2/?download.
[lxii] Anderson, J. (2025, May 20). US gas-fired turbine wait times as much as seven years; costs up sharply. S&P Global Energy. https://www.spglobal.com/energy/en/news-research/latest-news/electric-power/052025-us-gas-fired-turbine-wait-times-as-much-as-seven-years-costs-up-sharply.
[lxiii] North American Electric Reliability Corporation. (2026, January 29). Resource adequacy risks intensify across North America as demand growth surges. https://www.nerc.com/newsroom/resource-adequacy-risks-intensify-across-north-america-as-demand-growth-surges.
[lxiv] Frogash, E., Rathi, A., & Hirji, Z. (2026 April 1). The US data center boom is hitting a transformer crunch. Bloomberg Green Daily. https://www.bloomberg.com/news/newsletters/2026-04-01/us-data-center-boom-relies-on-hard-to-find-electrical-equipment.
[lxv] Edison Electric Institute. (2024). Industry data. https://www.eei.org/en/resources-and-media/industry-data/.
[lxvi] Federal Energy Regulatory Commission. (2025, May 13). Explainer on Transmission Planning and Cost Allocation Final Rule. https://www.ferc.gov/explainer-transmission-planning-and-cost-allocation-final-rule.
[lxvii] Supra note 15.
[lxviii] Wiser, R., Brooks, A., Donohoo-Vallet, P., Oskar, G., Frost, J., Brown, P., & Mai, T. (2024, October). Transmission Impact Assessment: Power Sector Infrastructure Deployment to Reduce Costs, Improve Reliability, and Lower Pollution. U.S. Department of Energy. https://www.energy.gov/sites/default/files/2024-10/DOE_OP_2024_Report-Transmission_Impact_Assessment.pdf.
[lxix] U.S. Department of Energy. (2024, April). The Future of Resource Adequacy: Solutions for clean, reliable, secure, and affordable electricity. https://www.energy.gov/sites/default/files/2024-04/2024%20The%20Future%20of%20Resource%20Adequacy%20Report.pdf.
[lxx] New York State Senate. (2025). Senate Bill S5687: Caps public gas corporations, public electric corporations and municipal gas and electric companies at a profit margin of four percent per year. https://www.nysenate.gov/legislation/bills/2025/S5687.