The Gap California Hasn’t Named
What California’s refinery crisis reveals about infrastructure cost management in every state
Introduction

On March 19, 2026, the California Transportation Commission approved the 2026 State Highway Operation and Protection Program (SHOPP): $17.9 billion for highway safety, bridge rehabilitation, and pavement repair for 607 projects over four years. The asphalt binder those projects require is a refinery product; so is the diesel that powers every piece of equipment. At the same time, Valero’s Benicia refinery ceased operations in April 2026, removing almost half of Northern California’s paving-grade asphalt binder supply and a significant share of the state’s diesel production.[1]
No state institution was positioned to see the cost impact of the coming closure, or to report on its scale. California’s exposure here is the most acute, but the gap it reveals exists everywhere states build without managing construction input costs. California makes the strongest case study because it has built more institutional infrastructure for managing adjacent risks than any other state, which makes the absence of this one harder to explain.
The proactive architecture
Understanding California’s proactive architecture is necessary in the course of identifying what the State has left unbuilt. The California Air Resources Board sets emissions trajectories decades into the future.[2] The Low Carbon Fuel Standard establishes carbon intensity reduction targets through 2045.[3] The Sustainable Groundwater Management Act requires every critically overdrafted basin to produce a groundwater sustainability plan with a 20-year implementation timeline.[4] CalPERS and CalSTRS manage pension risk across multi-decade horizons. The state consistently builds forward curves for understanding and managing environmental risks and then builds institutions to manage along those curves. However, one category of risk remains largely unmanaged: the future of materials that make California’s infrastructure possible.
What has no forward management curve?
The cost of building and maintaining California’s physical infrastructure. As of March 2026, Caltrans has 897 active construction contracts valued at $17.4 billion.[5] The majority of these projects consume some combination of asphalt binder, diesel, structural steel, Portland cement and aggregate. Diesel and asphalt binder carry documented California-specific cost premiums driven by fuel specifications, regulatory compliance costs and a contracting supply base. No institution, to our knowledge, produces a forward outlook for what these inputs will likely cost into the future. Caltrans publishes historical construction cost indexes based on quarterly bid data, but these are backward-looking records of what was bid, not forward projections of what inputs will cost. As a result, no mechanism enables contractors to effectively manage the California-specific component of their materials cost exposure at scale and at accessible cost.
The California Energy Commission (CEC) produces detailed quarterly assessments of refinery capacity, fuel supply trajectories and import dependency. The CEC knew Benicia was closing (Valero submitted notice to the CEC in April 2025, as required under SB X1-2). The CEC is working to assess crude oil supply implications. But the CEC’s analytical products are designed for energy market transparency, not infrastructure cost planning. To our knowledge, no institutional channel connects CEC fuel supply intelligence to the State’s largest infrastructure construction projects: Caltrans procurement and the High-Speed Rail Authority. Given the importance of infrastructure and construction costs, this represents a serious gap in California institutional planning.
Lost in translation
The first failure is a mandate gap, not an intentional design choice. In California, each agency’s scope was defined independently and no entity was assigned the connecting question.
California rigorously monitors the cost drivers that affect today’s infrastructure inputs. The CEC tracks fuel supply and refinery utilization. The California Public Utilities Commission (CPUC) monitors utility rates. Caltrans publishes historical construction cost indexes for major bid items including aggregate base, asphalt concrete, Portland cement concrete, reinforcing steel and structural steel. The surveillance and reporting functions are strong.
What is absent, to our knowledge, is a mechanism for translating that monitoring into proactive cost management for the state’s infrastructure portfolio. We found no evidence of CEC fuel supply intelligence being formally channeled to Caltrans procurement planning. The Benicia closure, which the CEC has been tracking since Valero submitted notice in April 2025, is the most recent test case; state level supply intelligence has not, to our knowledge, reached Caltrans procurement or materials cost planning. No public record indicates that Caltrans shares materials cost trend data with the Legislative Analyst’s Office in a format that connects to infrastructure appropriations analysis. The California Transportation Commission, which allocates SHOPP funding, does not appear to receive cost-driver intelligence as a formal input to project programming.
Each agency holds a piece of the picture. The agencies exist, the data exists, but nobody has connected them. The consequence is a state that monitors its infrastructure cost environment comprehensively but cannot act on what it monitors.
Orphaned risk
The second failure is a risk architecture gap: the state’s procurement system allocates cost risk but provides no mechanism for managing it.
In a well-structured construction contract, materials cost risk is allocated to the party best positioned to manage it. When hedging instruments exist, that party is typically the contractor, who can lock in prices through forward purchases or financial hedges. When instruments do not exist, the risk is allocated through the bidding process but usually cannot be managed by the receiving party. As a result, the contractor prices the unmanageable risk as a contingency in their bid. The state pays the contingency. Nobody manages the underlying exposure. The risk is “orphaned”: allocated but unmanaged.
California’s infrastructure input costs are orphaned at massive scale.
The scale of California’s risk orphaning is visible in contrast to the national infrastructure landscape. A 2025 survey published in the ASCE Journal of Legal Affairs and Dispute Resolution reviewed price adjustment clause implementation across all 50 state DOTs. The findings: 96 percent of state DOTs implement at least one type of materials price adjustment.[6] Fuel coverage at 84 percent. Asphalt at 80 percent. Steel at 36 percent. Portland cement at 6 percent. California’s coverage: asphalt (partial, indexed to crude oil rather than delivered binder price) and fuel (available but not standard) only. Steel and cement are not covered in standard specifications.
Start with asphalt. Caltrans operates a price adjustment mechanism for paving asphalt, triggered when the California Statewide Crude Oil Price Index moves more than five percent from the bid-date level. Until December 2024, this index was derived from posted crude oil prices for the Buena Vista and Midway Sunset fields. Starting in January 2025, Caltrans switched to Brent (UK) crude oil prices as the reference.[7] The adjustment captures national and global crude oil movement. It does not capture the California-specific premium on delivered asphalt binder, which is driven by refining capacity, regulatory compliance costs and regional supply configuration. With the closure of Northern California’s Benicia refinery, the basis between crude oil and California-delivered asphalt binder is widening structurally. The adjustment mechanism is indexing to the wrong benchmark.
Diesel tells a parallel story. In California, a special Fuel Cost Adjustment provision exists for state funded infrastructure projects and Caltrans publishes a California Statewide Fuel Price Index to support it. But the provision is not deployed as standard specification across the portfolio; it is only included in select contracts.[8] In contracts without the adjustment provision, equipment fuel cost is absorbed entirely by the contractor, then priced into the bid contingency. In practice this means a full-size paving spread running large equipment at eight to 10 hours per day and consuming approximately 600 to 800 gallons of diesel at March 2026 California diesel prices (~$6.87 per gallon) will burn through $4,100 to $5,500 per crew per day in fuel alone and passes this cost along to the state as a hidden premium.
Steel and Portland cement have no price adjustment provisions in Caltrans standard specifications. Caltrans has addressed steel cost spikes on an ad hoc basis (as in CPD 18-5, issued during the 2018 tariff-driven escalation)[9] and tracks construction cost indexes for structural and reinforcing steel. But the standard specifications contain no automatic adjustment mechanism for either input.
California is not uniquely deficient. Only 36 percent of state DOTs cover steel and 6 percent cover cement, but California is uniquely exposed because its infrastructure inputs carry premiums driven by fuel specifications, regulatory compliance costs and a contracting supply base that no other state faces at comparable scale. The national gap in steel and cement coverage is a problem everywhere. The indexing gap and the regulatory premium gap are California’s alone.

The contrast with peer states sharpens the cost point. New York’s materials price adjustments flow automatically through the regular progress payment cycle; California’s require a change-order request. The difference is not procedural. It is financial: Processing time generates a carrying cost that the contractor finances and, as standard construction economics would predict, recovers through higher subsequent bids.
NYSDOT’s Section 698 Standard Specifications cover fuel, asphalt and steel with automatic adjustment.[10] Posted prices are published monthly and the escalation computation is embedded in the bid and payment system. When the published index moves beyond the threshold, the payment adjustment flows through the regular progress payment cycle. No change-order request. No administrative review. No processing lag. California’s model requires the contractor to submit a change-order request that passes through resident engineer review, district office review and (for larger amounts) headquarters approval.
The aggregate statewide materials cost overruns across all infrastructure programs have never been aggregated and computed by any California agency. Caltrans tracks materials price levels through quarterly construction cost indices. DGS publishes the California Construction Cost Index. Project-level overruns are documented through individual supplemental funds requests. But no agency aggregates the materials-specific cost gap across the portfolio.
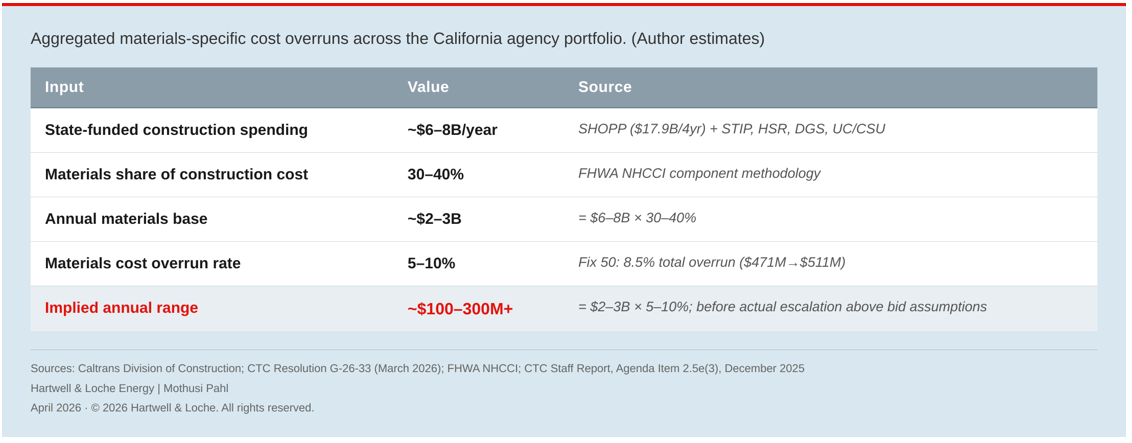
The pattern is visible in California’s own project record. The Fix 50 highway rehabilitation in Sacramento (14 miles of pavement replacement and HOV lanes, awarded at $471 million in 2020[11]) illustrates the pattern. Between June 2020 and July 2022, the Caltrans Crude Oil Price Index climbed from $155.90 to $646.00 per ton.[12]
By late 2024 the same project budget had grown to $511 million and the contractor and the state were in active dispute over cost attribution.[13] A California Transportation Commission staff report noted that the Department and the design-build contractor “still disagree on the methodology of time impact analysis” used to determine what is owed. Unpaid amounts accrued interest at 10 percent per year.[14] Where price adjustment provisions existed, they were indexed to Brent crude, not the delivered cost of binder, concrete, or diesel the contractor actually purchased.[15] The risk had been allocated but it had never been managed.
Why the market hasn’t solved this
If California-specific hedging instruments would reduce costs, why hasn’t the market created them?
The primary exchange-traded diesel benchmark, NYMEX ULSD (symbol HO), settles against delivery at New York Harbor.[16] CME does list a California-specific basis instrument: the Los Angeles CARB Diesel (OPIS) vs. NY Harbor ULSD spread swap (symbol JKL), a financially settled swap contract designed for sophisticated energy market participants. But the minimum NYMEX contract size is 42,000 gallons (1,000 barrels),[17] with margin requirements and daily mark-to-market settlement. A contractor consuming 10,000 to 50,000 gallons of diesel per month does not have the volume, credit profile or financial infrastructure to access even the primary instrument, let alone the basis swap on top of it.
For paving-grade asphalt binder, the hedging landscape is thinner still. Intercontinental Exchange (ICE) lists a Midcontinent Asphalt future (Argus-based, non-California-specific); Asphalt Unlimited LLC offers a proprietary synthetic hedge product based on energy futures correlations.[18] Neither instrument is accessible to a typical DOT contractor.
Even if a contractor could access the CME basis swap, it would hedge only the commodity differential. California’s infrastructure fuel costs include regulatory components that commodity instruments cannot reach. The Low Carbon Fuel Standard adds approximately $0.08 to $0.20 per gallon to diesel at 2025 credit prices.[19] Cap-and-Invest (formerly Cap-and-Trade) adds approximately $0.23 to $0.27 per gallon at recent allowance prices.[20]
Neither cost is stable. LCFS credits ranged from $40 to $75 per metric ton in 2025 alone, with a regulatory ceiling of $269; a one-day 9 percent step-change in carbon intensity reduction targets on July 1, 2025 added approximately $0.07 per gallon overnight. Cap-and-Invest allowance prices are bounded by a floor of approximately $26 and a ceiling of $95, but the trajectory depends on CARB rulemaking, not commodity fundamentals.
ICE launched LCFS credit futures in February 2025 and open interest reached 152,000 lots by September.[21] But these instruments hedge regulatory cost exposure for fuel producers, not delivered fuel cost for infrastructure contractors. A commodity hedge plus a basis swap plus an LCFS credit hedge still leaves a contractor exposed to Cap-and-Invest allowance cost variability and each additional layer adds cost, counterparty requirements and monitoring burden that small and mid-size contractors cannot absorb.
These modestly sized contractors constitute the bulk of the state’s infrastructure cost exposure and lack the volume, credit profile and financial infrastructure to access exchange-traded futures markets. The state has not stepped into this gap. No California public agency has been identified as having hedged fuel costs through bilateral instruments; Caltrans uses price adjustment clauses, not financial hedging. The absence of any public-facing state policy framework for commodity hedging suggests the mechanism has not been institutionally considered.
The market has not failed to try. California-specific basis instruments exist, LCFS credit futures are growing in liquidity and bilateral hedging is available through commodity trading desks. But the structural requirements for a complete California infrastructure fuel hedge exceed what most commodity markets are designed to deliver. The open market fails both the largest buyers (states) and the smallest resellers (contractors who pass input costs through as finished infrastructure) who would benefit most from price certainty.
What closes the gap
This market failure leaves state institutions as the primary actors with both the standing and the scale to close the gap. The fix is not to build hedging capacity for contractors; it is to manage the exposure that contractors cannot hedge. The institutional architecture California needs is the same architecture every major infrastructure state lacks. These interventions range from specification changes Caltrans can make today to structural reforms that require legislation.
The three tiers of Recommendations ordered by achievability:
Tier 1: Specification-level fixes (2026–2027): Expand the Fuel Cost Adjustment special provision to all contracts over $10 million as a standard specification. The provision already exists and has been deployed on select contracts.
Update the Crude Oil Price Index methodology from Brent crude to a California-specific asphalt binder price reference. As the orphaned risk section demonstrates, the basis between Brent crude and California-delivered asphalt binder is widening structurally. With the recent Benicia refinery closure, the current index is measuring the wrong commodity.
Add structural steel and Portland cement using FHWA model specification language that New York and other peer states have already adopted. Set a 30-day processing target for materials cost change orders; the current multi-stage review process generates carrying costs that contractors finance and recover through higher subsequent bids.
All of these changes are specification-level. None require legislation. The barrier is not legal constraint. It is that no one has assigned the priority. That barrier is not unique to California; every state DOT has specification authority over its own price adjustment provisions, and fewer than 6 percent use it for cement.
Tier 2: Institutional connection (2027): The Legislature or California State Transportation Agency should direct the California Energy Commission, Caltrans, the Legislative Analyst’s Office and the Department of General Services to produce a quarterly California Infrastructure Input Cost Outlook that synthesizes CEC fuel supply data, Caltrans materials price trends, LAO fiscal impact analysis and DGS procurement intelligence. The deliverable is the translation mechanism. It would be the first time those four data streams were read together.
Separately, the LAO should compute and publish the trailing-24-month aggregate materials cost overrun across SHOPP, high-speed rail and state building construction. No agency currently aggregates this materials-specific cost gap across the portfolio. The LAO has the analytical capability to produce the number, but nobody has been asked to compute it. No state, to our knowledge, currently produces an interagency infrastructure input cost outlook or publishes a portfolio-level materials cost overrun figure. The gap is not California’s alone; it is the national default condition.
Tier 3: Structural reforms (2027–2029): Establish a California Infrastructure Materials Cost Index: five inputs, California-delivered, independently audited, published quarterly. The Legislature should mandate its use in all state-funded construction contracts across all agencies, standardizing materials cost management practices that currently vary across Caltrans, the High Speed Rail Authority, Department of General Services, the University of California, and the Cal State University system.
No state, to our knowledge, currently mandates a standardized materials cost index across its infrastructure agencies. The specific agencies named here are California’s. The institutional gaps they would close (no forward cost outlook, no interagency cost intelligence, no standardized materials cost index) are not.
Conclusion: The gap nobody measures
The cost of leaving California’s infrastructure cost management gap unmeasured is not speculative. It is embedded in every bid contingency on every active Caltrans contract, in every crew that burns thousands of dollars in diesel per day without a price adjustment mechanism. That cost accrues whether or not anyone measures it.
The surveillance functions to capture these costs exist. Caltrans, DGS, the California Transportation Commission and individual resident engineers all track pieces of the cost picture. What does not exist is any institution whose job it is to aggregate the materials-specific cost gap across the portfolio and to compute what the state’s infrastructure programs actually lose to unhedged input cost volatility.
California has built world-class institutions to: manage environmental risk proactively, project-level cost risk administratively, and materials price trends statistically. The institutional infrastructure to connect these data streams and manage the economic consequences with equivalent sophistication does not yet exist. The gap is not analytical capability. It is institutional assignment.
Until this responsibility is assigned, California (and many other states) will continue to plan decades ahead on emissions, and groundwater, and pension exposures while leaving the most basic components of infrastructure economics to chance.
Mothusi Pahl serves on the Advisory Council of the Alliance for Innovation and Infrastructure and on the Board of Directors of the Great Plains Institute. He is Principal at Hartwell and Loche, a strategic advisory practice focused on energy, regulated industries and commercial strategy.
Published with the Alliance for Innovation and Infrastructure (Aii). The views and opinions expressed are solely those of the author and do not necessarily reflect the views of Aii or its leadership.
[1] F&L Asia, “Valero Plans to Restructure or Cease Benicia Refinery Ops,” April 23, 2025; corroborated in Forticon, “How California’s Refinery Closures Hit Asphalt Contractors,” For Construction Pros, December 18, 2025.
[2] CARB, 2022 Scoping Plan for Achieving Carbon Neutrality, adopted December 15, 2022.
[3] CARB, “CARB Updates the Low Carbon Fuel Standard,” November 8, 2024; effective July 1, 2025. CI reduction targets: 30 percent by 2030, 90 percent by 2045.
[4] California Water Code §10720 et seq. (Sustainable Groundwater Management Act, 2014).
[5] Caltrans, Division of Construction, dot.ca.gov/programs/construction (updated March 2, 2026).
[6] “Price Adjustment Clauses in Highway Construction: State of the Practice,” ASCE J. Legal Affairs and Dispute Resolution, Vol. 18, No. 2 (2025). DOI: 10.1061/JLADAH.LADR-1485.
[7] Caltrans CPD 24-11, “California Statewide Crude Oil Price Index Update,” December 24, 2024.
[8] Caltrans Fuel Price Index, dot.ca.gov/programs/construction/ca-sw-fuel-price-index.
[9] Caltrans CPD 18-5, issued 2018.
[10] NYSDOT Standard Specifications, Section 698.
[11] Caltrans, “U.S. Highway 50 Multimodal Corridor Enhancement and Rehabilitation Project,” project page, District 3, https://dot.ca.gov/caltrans-near-me/district-3/d3-projects/d3-us-50-hov-lane-0h08u.
[12] California Department of Transportation, “California Statewide Crude Oil Price Index,” Division of Construction, https://dot.ca.gov/programs/construction/california-statewide-crude-oil-price-index. June 2020 index: $155.90/ton; July 2022 index: $646.00/ton.
[13] Sergio Ochoa Sánchez, Caltrans spokesperson, quoted in Dillon Townes, “Caltrans’ Fix 50 Project 2 Years behind Schedule, $40M over Budget,” ABC10, January 23, 2026, https://www.abc10.com/article/news/local/sacramento/caltrans-fix-50-project-behind-schedule-40-million-budget/103-d1932dae-8449-436b-b750-3f6ee03be8a7.
[14] California Transportation Commission, Staff Report, Agenda Item 2.5e(3), December 2025 meeting, https://catc.ca.gov/-/media/ctc-media/documents/ctc-meetings/2025/2025-12/80-2-5e3-a11y.pdf.
[15] California Department of Transportation, “California Statewide Crude Oil Price Index”: “Starting in January 2025, the Department determines the California Statewide Crude Oil Price Index each month … using the daily Brent crude oil prices from the previous month, as reported by Business Insider.”
[16] CME Group, NYMEX ULSD Futures (HO), cmegroup.com/markets/energy/refined-products.html.
[17] CME Group, LA CARB Diesel vs. NY Harbor ULSD spread swap (JKL); Mercatus Energy, fuel hedging guide.
[18] ICE, Midcontinent Asphalt Future, ice.com/products/83047324; Asphalt Unlimited LLC.
[19] LAO, “Assessing California’s Climate Policies,” May 2025; CRS R48314, December 2024; Stillwater Publications.
[20] LAO (May 2025); CRS R48314 (December 2024); CARB Cap-and-Invest auction data.
[21] ICE LCFS credit futures; CFTC Submission No. 25-13, January 2025.